• News
    • Bitcoin
    • Altcoins
    • Blockchain
    • DeFi
    • Regulation
    • Scams
  • NFT
  • Metaverse
  • Analysis
  • Learn
  • Videos
  • Blogs
  • Market Cap
  • Shop
What's Hot

What Is Gwei in Crypto? A Guide to Ethereum Gas Fees

2026-05-09

What Is AML in Crypto? Anti–Money Laundering Explained for Beginners

2026-05-09

What Are Social Tokens in Crypto? How Creators and Communities Use Them

2026-05-08

Subscribe to Updates

Get the latest creative news from FooBar about art, design and business.

Facebook Twitter Instagram
Crypto Investor News Network
  • News
    • Bitcoin
    • Altcoins
    • Blockchain
    • DeFi
    • Regulation
    • Scams
  • NFT

    Bitcoin Just Hit an All-Time High. Nobody Cares

    2025-09-11

    All Eyes on Art: Upcoming Collections to Watch the Week of May 27

    2025-09-11

    Bitcoin Vegas Belongs to the Suits Now

    2025-09-11

    NFC Summit Lisbon Founder on Evolving the Event and Weathering the Market

    2025-09-11

    All Eyes on Art: Upcoming Collections to Watch the Week of June 3

    2025-09-10
  • Metaverse

    Shib: The Metaverse – Part of the Expanding Shiba Inu Ecosystem

    2025-01-03

    Experience to Earn: Everdome’s Metaverse Frontier

    2024-12-30

    Beyond Bots: Meta Motivo and the Dawn of Humanlike Digital Life

    2024-12-13

    Exploring NetVRk: What Is Behind This AI-Driven Virtual Universe?

    2024-10-28

    Council of Europe Highlights Metaverse’s Impact on Privacy and Democracy

    2024-09-05
  • Analysis

    Crypto Exchange Coinbase Lists New DeFi Altcoin Project Built on Base Blockchain

    2023-12-13

    Ethereum Price Bears Keep Pushing, Why Decline Isn’t Over Yet

    2023-12-13

    Trader Bullish on Cosmos (ATOM), Says One Dogecoin Rival Setting Up for Next Leg Up – Here’s His Outlook

    2023-12-13

    AVAX Price Pumps 50% and Dumps 15%, Why Uptrend Is Still Strong

    2023-12-13

    Top Trader Predicts Parabolic Rally for Solana Competitor – Here’s His Upside Target

    2023-12-13
  • Learn

    What Is Gwei in Crypto? A Guide to Ethereum Gas Fees

    2026-05-09

    What Is AML in Crypto? Anti–Money Laundering Explained for Beginners

    2026-05-09

    What Are Social Tokens in Crypto? How Creators and Communities Use Them

    2026-05-08

    All-Time High vs. All-Time Low

    2026-05-08

    Survey and Open Talk – Cryptocurrency News & Trading Tips – Crypto Blog by Changelly

    2026-05-05
  • Videos

    AI’s Brutal 5D Power Play: Crypto’s New Role & The Next $Trillion Winners! 📈🤖

    2026-05-07

    Bitcoin Just Flashed A Rare Shocking Signal…

    2026-05-07

    Trading…The Math of Getting Wiped Out

    2026-05-06

    Bitcoin Is About To Trigger a MASSIVE Short Squeeze

    2026-05-06

    Terra Luna Classic Just Dropped A Zero! Traders Pouring In!

    2026-05-05
  • Blogs
  • Market Cap
  • Shop
Facebook Twitter Instagram TikTok
Crypto Investor News Network
Home»Analysis»Bitcoin at $28.5K: Unpacking the significance of tight Bollinger Bands
Analysis

Bitcoin at $28.5K: Unpacking the significance of tight Bollinger Bands

2023-08-17No Comments3 Mins Read
Facebook Twitter Pinterest LinkedIn Tumblr Email
Share
Facebook Twitter LinkedIn Pinterest Email

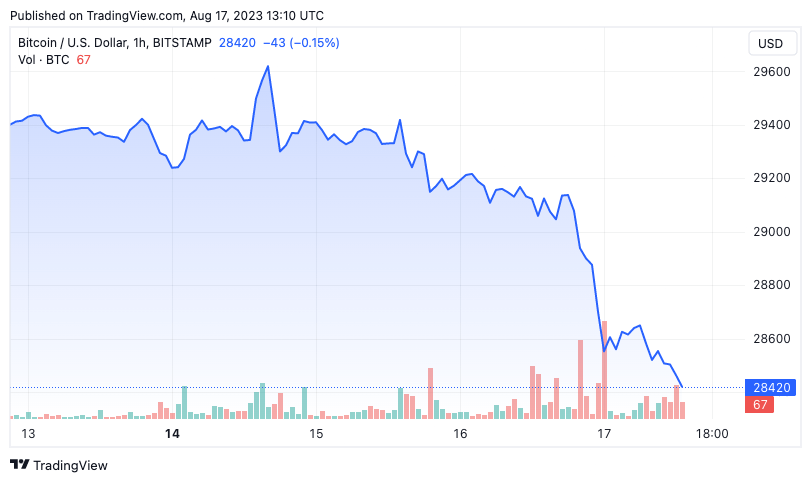
On Aug. 17, Bitcoin’s price dropped below the $29,000 mark, settling around $28,500. While this decline might seem insignificant given Bitcoin’s historically volatile nature, the context of its recent trading range magnifies the importance of this move.

bitcoin price
Graph showing Bitcoin’s price between Aug. 14 and Aug. 17, 2023 (Source: CryptoSlate BTC)

Bollinger Bands are a financial tool used to assess the price volatility of various assets, including Bitcoin. The bands contain three lines — one central line and two outer ones. The central line on the chart represents the simple moving average (SMA) of the asset’s price, while the outer bands are determined by the standard deviation, a measure indicating how spread out the prices are from the average.

These bands widen during periods of high volatility and contract during low volatility. These bands are a crucial market indicator, helping traders identify potential buy and sell signals. When an asset’s price moves outside these bands, it can indicate a significant price movement in the breakout direction.

August has seen Bitcoin’s price volatility plummet to historical lows. Before today’s drop to $28,500, the upper and lower Bollinger Bands were separated by a mere 2.9%. Such a tight spread has only been witnessed twice in Bitcoin’s history. With the descent to $28,500, Bitcoin’s price breached the lower Bollinger Band, which stood at $28,794. Consequently, the Bollinger Band range expanded slightly to 3.2%.

bollinger bands bitcoin 3mo
Graph showing the range for Bitcoin Bollinger Bands from May 17 to Aug. 17, 2023 (Source: Glassnode)

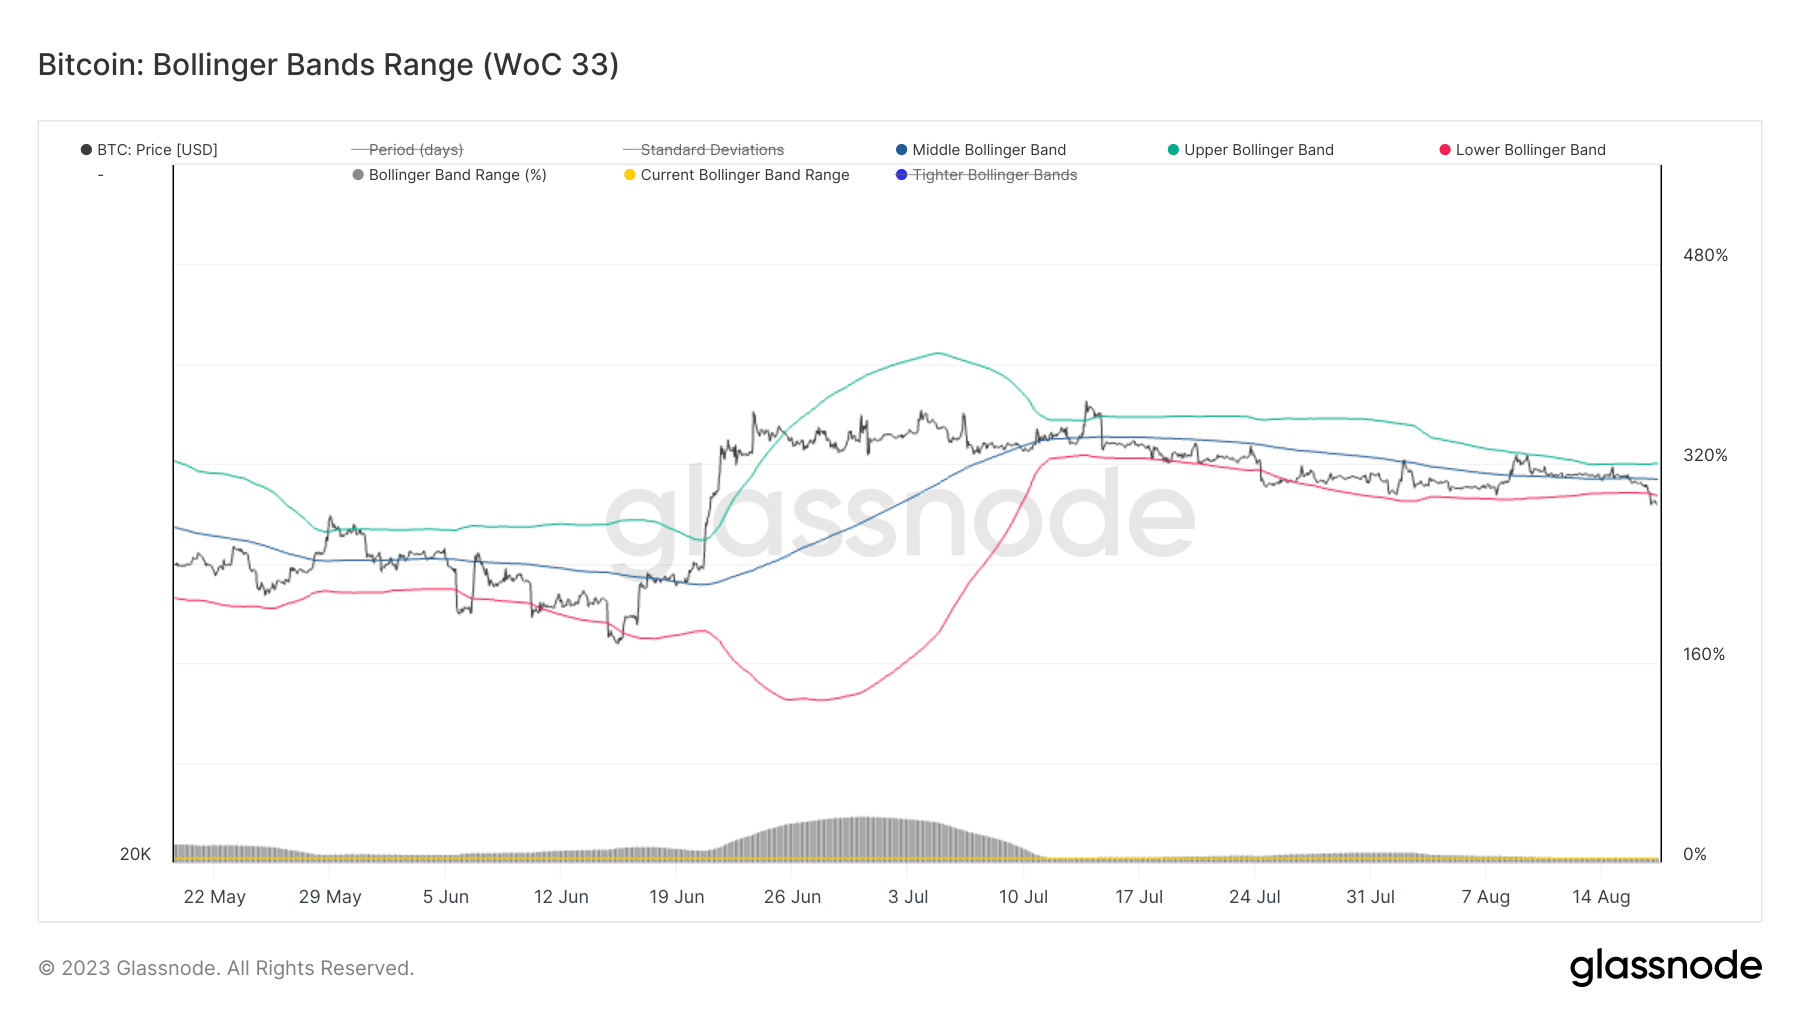
Historical data suggests that when Bitcoin’s price breaks below the lower Bollinger Band, it is often followed by a swift recovery and an upward trajectory. This pattern has been observed multiple times, reinforcing the significance of the Bollinger Bands as a predictive tool.

See also  Popular Crypto Analyst Says Bitcoin’s Short-Term Volatility a Distraction From Upward Macro Trend

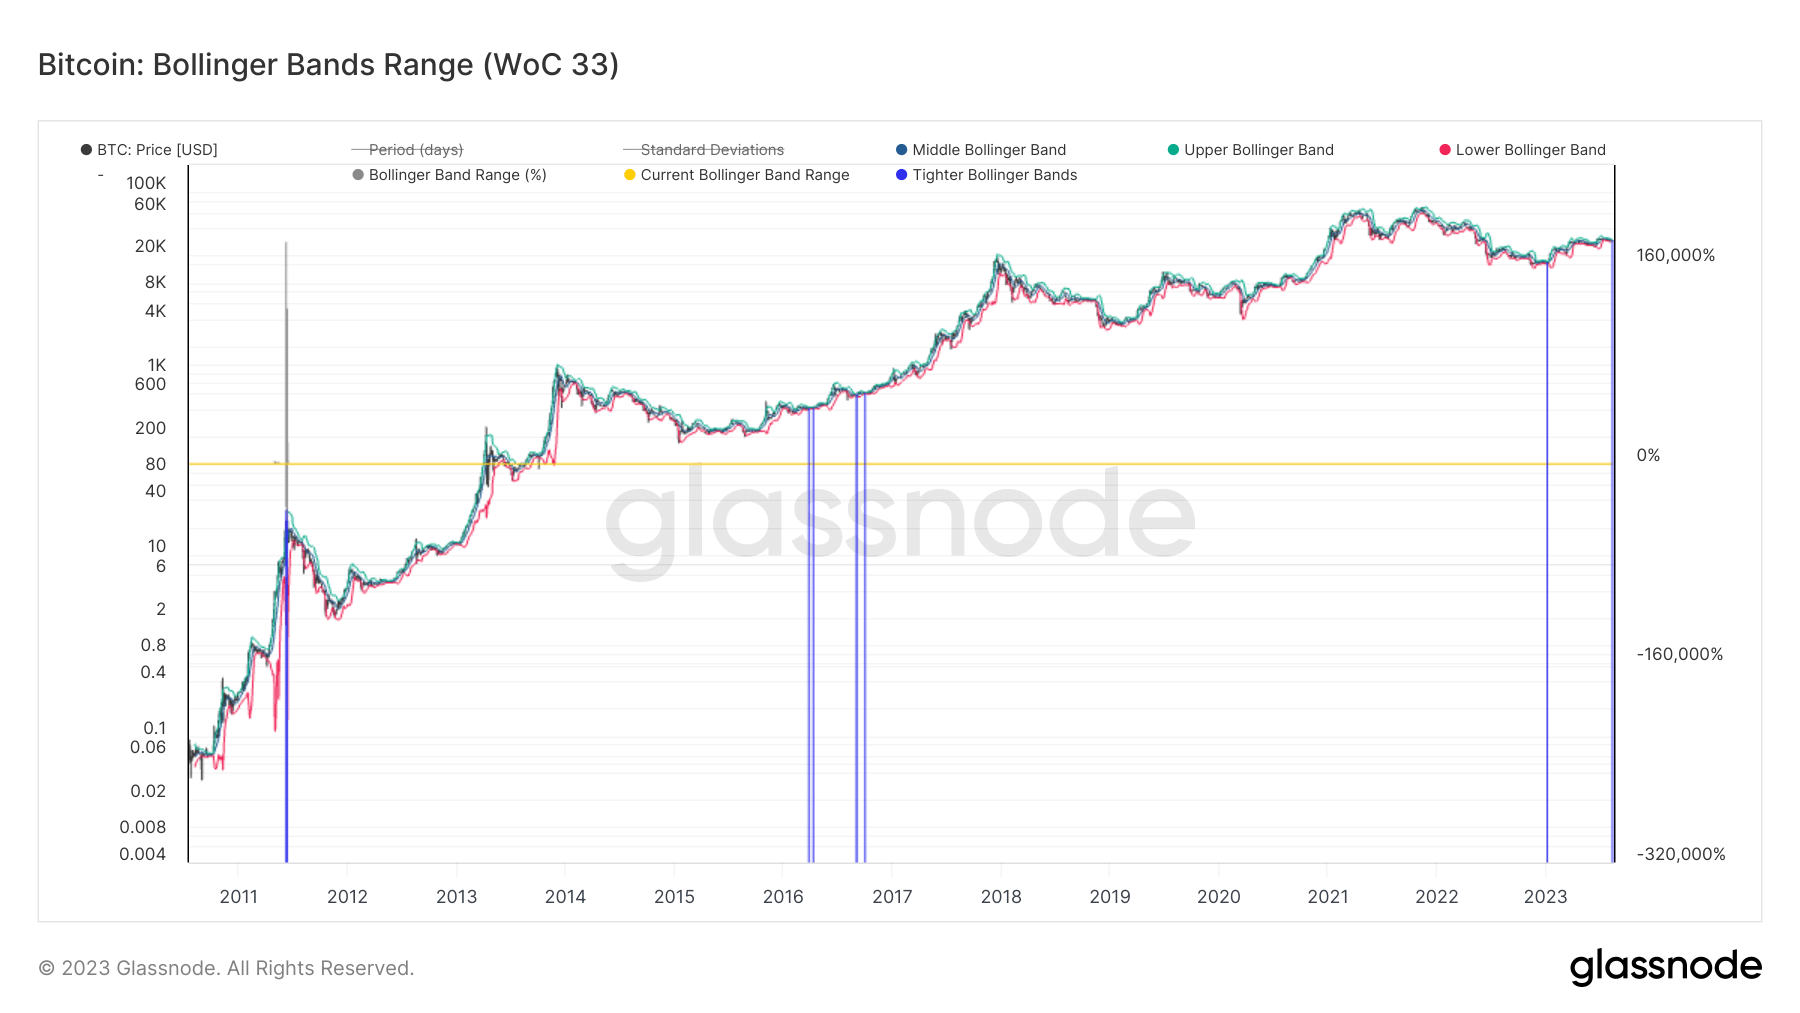
Furthermore, every instance of extremely tight Bollinger Bands in Bitcoin’s history has preceded a notable price swing. For instance, several occurrences of equally tight bands were recorded in 2016. This period was the precursor to the rally that propelled Bitcoin to its all-time high in 2018. More recently, in January 2023, Bitcoin’s price remained stagnant at around $16,800, with the bands indicating low volatility. Shortly after, Bitcoin surged, nearly doubling its value to $30,000.

bollinger bands btc historical
Graph showing the range for Bitcoin Bollinger Bands from 2010 to 2023 (Source: Glassnode)

So, what do these observations imply for the market? The current tightness of the Bollinger Bands, combined with Bitcoin’s price movement below the lower band, suggests a potential for a significant price upswing in the near future.

The post Bitcoin at $28.5K: Unpacking the significance of tight Bollinger Bands appeared first on CryptoSlate.

28.5K Bands Bitcoin Bollinger significance tight Unpacking
Share. Facebook Twitter Pinterest LinkedIn Tumblr Email

Related Posts

Bitcoin Just Flashed A Rare Shocking Signal…

2026-05-07

Bitcoin Is About To Trigger a MASSIVE Short Squeeze

2026-05-06

Bitcoin Just Flashed A Massive $100K Signal

2026-05-05

Bitcoin Is Reclaiming The Bull Market

2026-05-04
Add A Comment

Leave A Reply Cancel Reply

Top Posts
Videos

Bitcoin SURGES Above $68,000 | SEC Attacking Ethereum

2024-03-20

Today let’s talk about Bitcoin’s huge recovery today to $67000. Also what’s going on Ethereum?…

Bitcoin

Bitcoin worth $128 million sent to exchanges: What now?

2023-09-08

Journalist Posted: September 8, 2023 Bitcoin’s rise in exchange supply has not been able to…

Regulation

The crypto crackdown will alienate ‘would-be Democrats’: Cameron Winklevoss

2023-06-11

What is CryptoSlate Alpha?A web3 membership designed to empower you with cutting-edge insights and knowledge.…

Subscribe to Updates

Get the latest news and Update from CINN about Crypto, Metaverse and NFT.

Editors Picks

What Is Gwei in Crypto? A Guide to Ethereum Gas Fees

2026-05-09

What Is AML in Crypto? Anti–Money Laundering Explained for Beginners

2026-05-09

What Are Social Tokens in Crypto? How Creators and Communities Use Them

2026-05-08

All-Time High vs. All-Time Low

2026-05-08
Crypto Investor News Network
Facebook Twitter Instagram TikTok
  • Contact
  • Terms & Conditions
  • Privacy Policy
  • DMCA
  • Disclouser
© 2026 - All rights are reserved.

Type above and press Enter to search. Press Esc to cancel.

bitcoin
Bitcoin (BTC) $ 80,751.00
ethereum
Ethereum (ETH) $ 2,327.61
tether
Tether (USDT) $ 0.999773
xrp
XRP (XRP) $ 1.42
bnb
BNB (BNB) $ 647.39
usd-coin
USDC (USDC) $ 0.999794
solana
Solana (SOL) $ 93.10
tron
TRON (TRX) $ 0.350414
figure-heloc
Figure Heloc (FIGR_HELOC) $ 1.03
staked-ether
Lido Staked Ether (STETH) $ 2,265.05