• News
    • Bitcoin
    • Altcoins
    • Blockchain
    • DeFi
    • Regulation
    • Scams
  • NFT
  • Metaverse
  • Analysis
  • Learn
  • Videos
  • Blogs
  • Market Cap
  • Shop
What's Hot

Bitcoin Bulls Return Amid Iran War Chaos

2026-03-04

More Global Trouble Ahead… What This Means for Bitcoin

2026-03-03

DOJ seizures of $580M expose how crypto investment scams scaled into shift work with quotas and scripts

2026-03-03

Subscribe to Updates

Get the latest creative news from FooBar about art, design and business.

Facebook Twitter Instagram
Crypto Investor News Network
  • News
    • Bitcoin
    • Altcoins
    • Blockchain
    • DeFi
    • Regulation
    • Scams
  • NFT

    Bitcoin Just Hit an All-Time High. Nobody Cares

    2025-09-11

    All Eyes on Art: Upcoming Collections to Watch the Week of May 27

    2025-09-11

    Bitcoin Vegas Belongs to the Suits Now

    2025-09-11

    NFC Summit Lisbon Founder on Evolving the Event and Weathering the Market

    2025-09-11

    All Eyes on Art: Upcoming Collections to Watch the Week of June 3

    2025-09-10
  • Metaverse

    Shib: The Metaverse – Part of the Expanding Shiba Inu Ecosystem

    2025-01-03

    Experience to Earn: Everdome’s Metaverse Frontier

    2024-12-30

    Beyond Bots: Meta Motivo and the Dawn of Humanlike Digital Life

    2024-12-13

    Exploring NetVRk: What Is Behind This AI-Driven Virtual Universe?

    2024-10-28

    Council of Europe Highlights Metaverse’s Impact on Privacy and Democracy

    2024-09-05
  • Analysis

    Crypto Exchange Coinbase Lists New DeFi Altcoin Project Built on Base Blockchain

    2023-12-13

    Ethereum Price Bears Keep Pushing, Why Decline Isn’t Over Yet

    2023-12-13

    Trader Bullish on Cosmos (ATOM), Says One Dogecoin Rival Setting Up for Next Leg Up – Here’s His Outlook

    2023-12-13

    AVAX Price Pumps 50% and Dumps 15%, Why Uptrend Is Still Strong

    2023-12-13

    Top Trader Predicts Parabolic Rally for Solana Competitor – Here’s His Upside Target

    2023-12-13
  • Learn

    What Is Liquid Proof-of-Stake and How It Works?

    2026-03-02

    The 9 Most Common Crypto Scams (And How to Spot Them)

    2026-03-02

    What Is a Sidechain? A Beginner’s Guide to Blockchain Scaling

    2026-02-20

    What Is Range Trading in Crypto? Strategy, Examples & Risks

    2026-02-19

    What Is Cryptocurrency Algo Trading? Strategies, Risks, and How to Start

    2026-02-19
  • Videos

    Bitcoin Bulls Return Amid Iran War Chaos

    2026-03-04

    More Global Trouble Ahead… What This Means for Bitcoin

    2026-03-03

    Bitcoin Made HUGE Moves Today…

    2026-03-02

    Why is there no BITCOIN War Premium?📈

    2026-03-02

    First BIP-110 Bitcoin Block Mined

    2026-03-02
  • Blogs
  • Market Cap
  • Shop
Facebook Twitter Instagram TikTok
Crypto Investor News Network
Home»Analysis»XRP Exhibits Bearish Chart Pattern
Analysis

XRP Exhibits Bearish Chart Pattern

2023-06-15No Comments3 Mins Read
Facebook Twitter Pinterest LinkedIn Tumblr Email
Share
Facebook Twitter LinkedIn Pinterest Email

In the past 48 hours, the price of XRP has experienced notable volatility, dropping below $0.50. The crypto market is closely focused on XRP due to a recent favorable development in the Securities and Exchange Commission (SEC) vs. Ripple lawsuit.

The emergence of the Hinman documents has sparked inquiries into the actions of the Securities and Exchange Commission. Although XRP witnessed positive price action earlier this year, the altcoin has faced challenges due to ongoing market volatility. This has led to a break below significant support levels.

Over the last 24 hours, XRP has seen a close to 7% dip. There has been an 8% depreciation on the weekly chart. Both the demand and accumulation of the asset have remained low. This indicated a dominant bearish trend. The fear index remains high in the market, contributing to a decline in investor confidence.

Failure to surpass the $0.50 level may result in a significant loss of value for XRP during the next trading session. Furthermore, the decrease in the altcoin’s market capitalization reinforces the weak buying power reflected on the chart.

XRP Price Analysis: One-Day Chart

XRP
XRP was priced at $0.47 on the one-day chart | Source: XRPUSD on TradingView

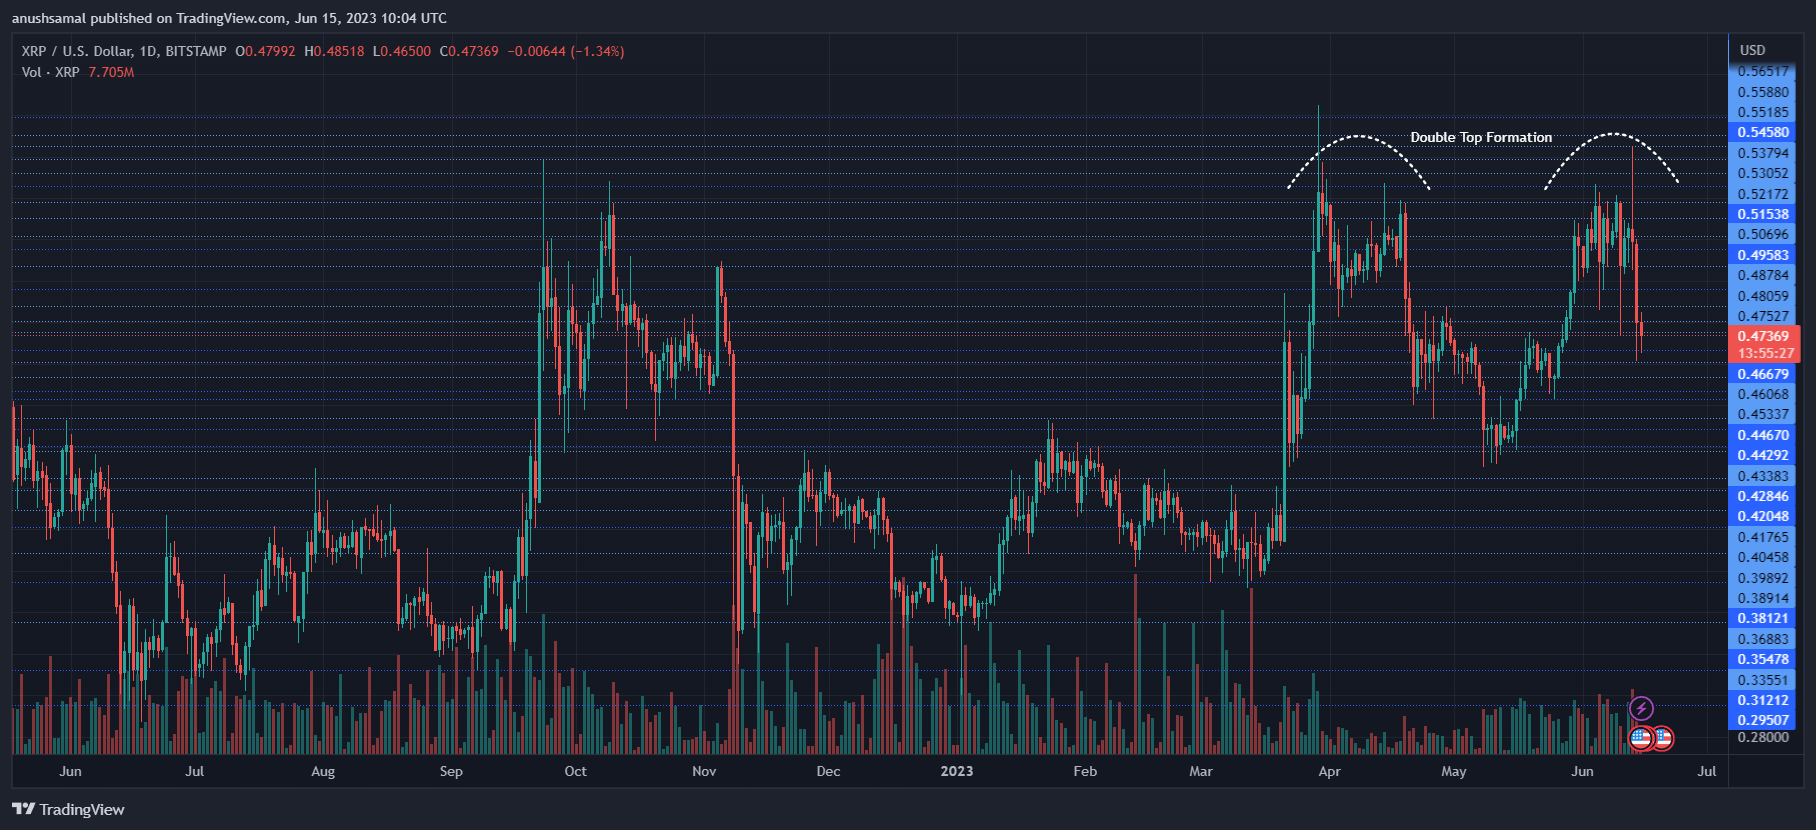
As of the time of writing, the altcoin XRP was trading at $0.47. Following the rejection of the bulls at $0.50, XRP has been experiencing a downward trend.

The coin faced resistance at $0.50, and it is anticipated that it may encounter even stronger resistance at $0.55. If the altcoin fails to surpass the $0.55 mark, it will likely dip to its local support level of $0.46 and potentially further down to $0.43.

See also  Whales Move Over $730,000,000 in Bitcoin, Ethereum and XRP – Here’s Where the Crypto’s Headed

Moreover, the altcoin has formed a bearish double-top pattern, indicating a potential reversal in its price trend as it moves downward on the chart. The trading volume of XRP has also declined in the last session, suggesting that sellers have taken control of the asset.

Technical Analysis

XRP
XRP displayed a fall in buying strength on the one-day chart | Source: XRPUSD on TradingView

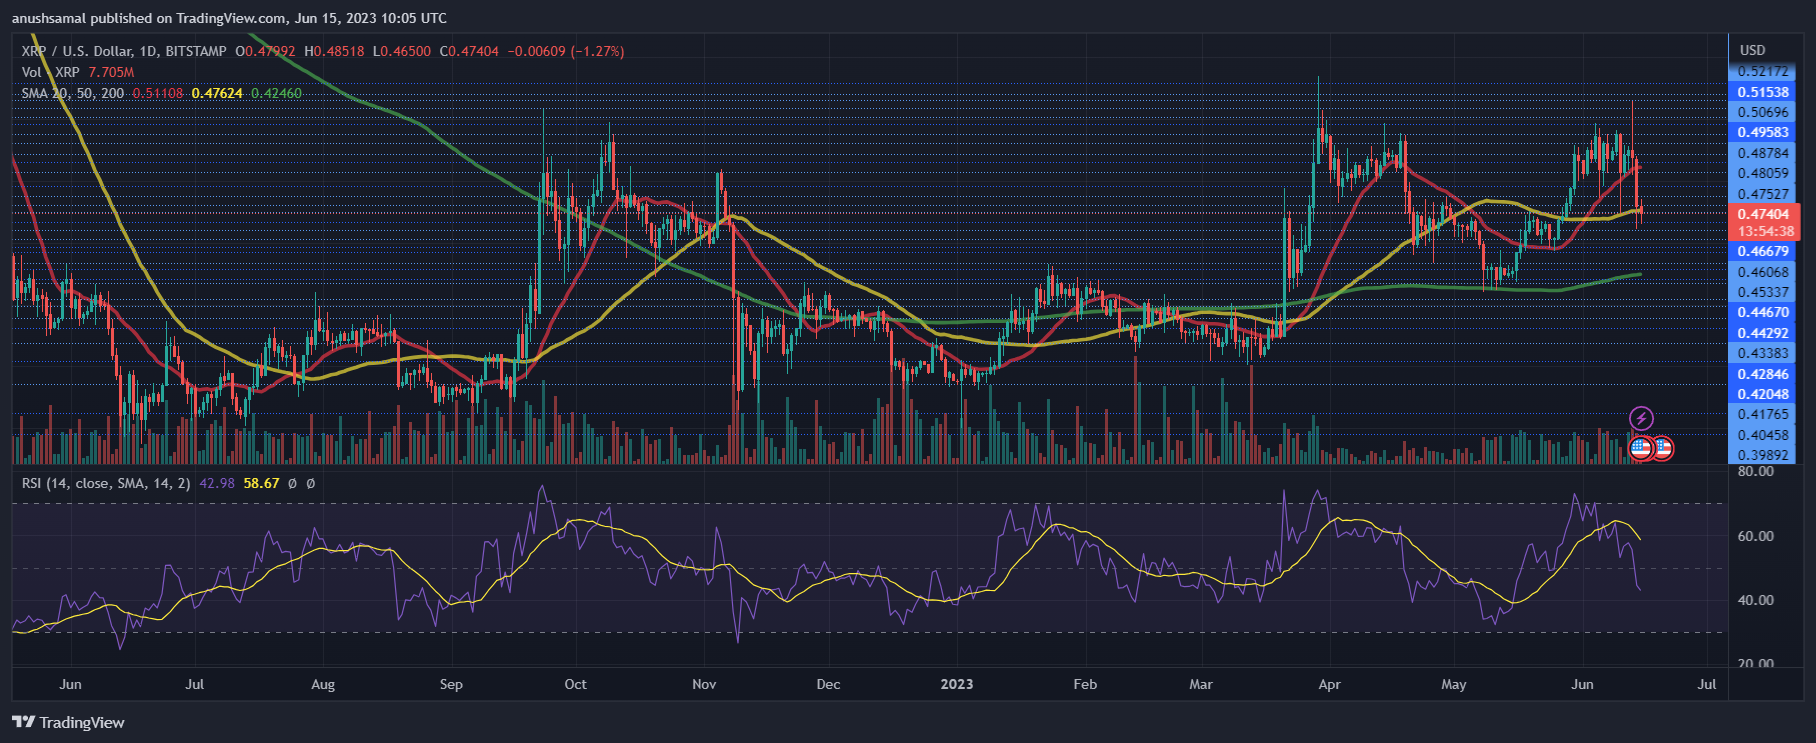
During the majority of this month, XRP witnessed a decline in demand. This was reflected by the Relative Strength Index (RSI) falling below the half-line, indicating that sellers had taken control of the asset.

Additionally, XRP fell below the 20-Simple Moving Average (SMA), suggesting low demand and indicating that sellers were driving the price momentum in the market.

However, if the altcoin trades near the $0.50 price mark, it can potentially bring the price back above the 20-SMA line. This would essentially indicate a resurgence in demand for the asset.

XRP
XRP displayed increased sell signals on the one-day chart | Source: XRPUSD on TradingView

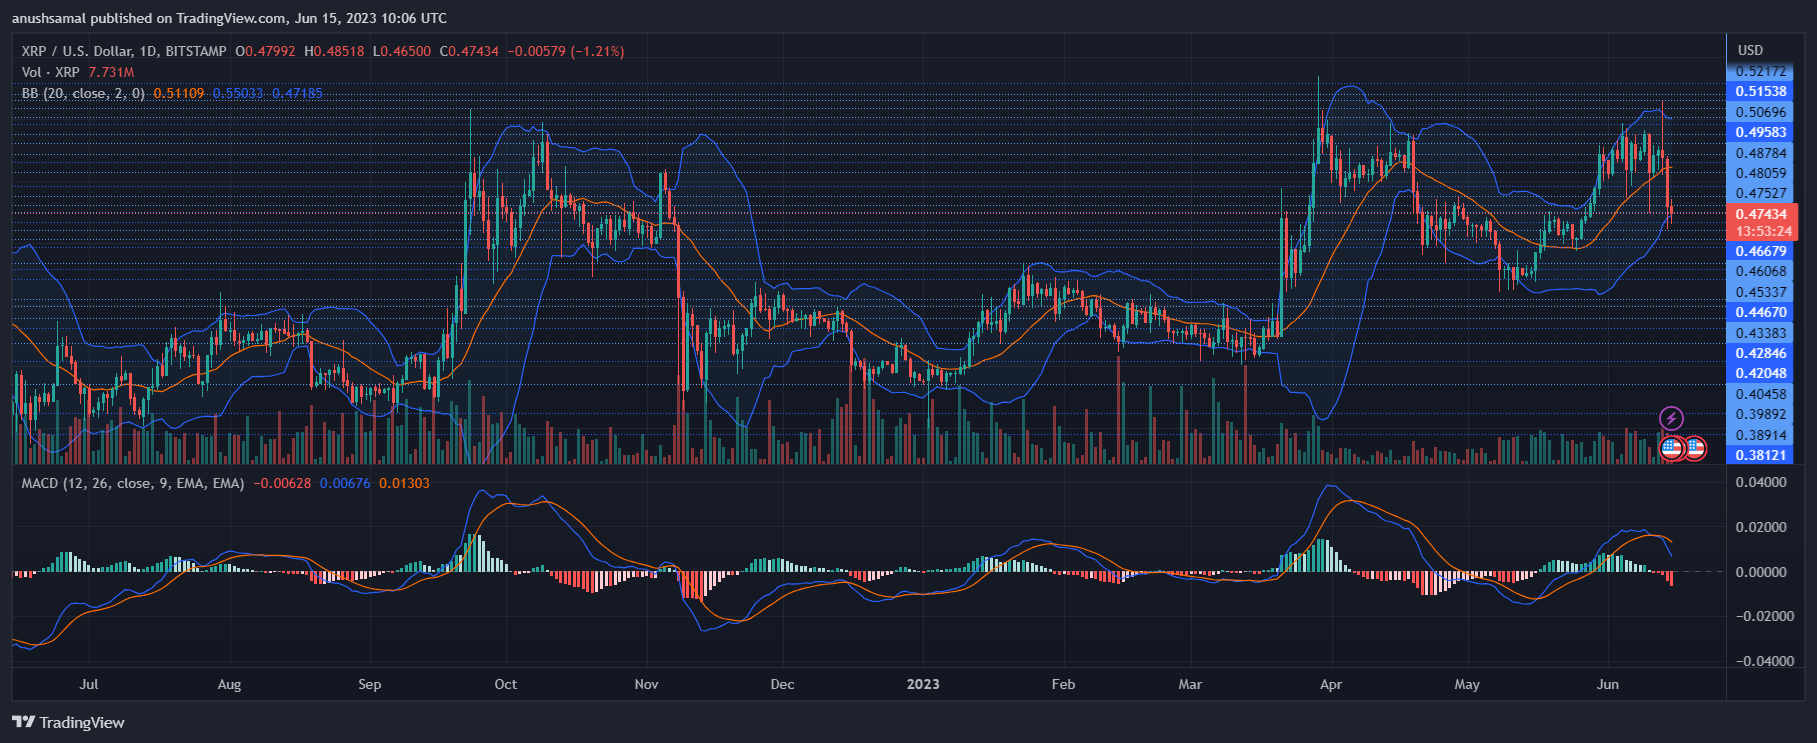
In addition to the mentioned technical indicators, other signals on the chart for the altcoin indicate selling pressure. The Moving Average Convergence Divergence (MACD) formed red histograms, signalling sell signals for the altcoin and indicating a bearish sentiment in the market.

Related Reading: Ethereum Bears Set Their Sights On Next Downside Target If $1,700 Support Breaks

Furthermore, the Bollinger Bands have widened, indicating increased volatility and potential price fluctuations for the altcoin in the upcoming trading sessions. This suggests that the price of XRP may experience significant changes and unpredictability in the near term.

Featured Image From UnSplash, Charts From TradingView.com

Bearish Chart exhibits pattern XRP
Share. Facebook Twitter Pinterest LinkedIn Tumblr Email

Related Posts

Which Chart to TRADE?!📈 (BTC Math, SOL 10K, ONDO, & STRC Yield)

2026-03-01

Is It Over For XRP Or Is This Prime Opportunity?

2026-02-05

HUGE Crypto CRASH, BITCOIN, XRP, ETHEREUM Price Prediction (IMPORTANT!!)

2026-02-05

What Is Technical Analysis in Crypto? A Beginner’s Guide to Chart Reading and Indicators

2026-01-28
Add A Comment

Leave A Reply Cancel Reply

Top Posts
Videos

Bitcoin Holders…This Is Where We Are In the Cycle

2024-09-06

Today, let’s look at Bitcoin and the US market and where exactly we are in…

NFT

How to Get Free NFT Drops?

2023-12-28

Given the abundance of new NFT projects, and established projects minting new collectibles, users are…

Videos

Bitcoin Holders…Brace Yourselves for a Historic Week

2024-07-22

Today, let’s discuss Bitcoin, Elon Musk, and Trump’s involvement this week. New All-Time High this…

Subscribe to Updates

Get the latest news and Update from CINN about Crypto, Metaverse and NFT.

Editors Picks

Bitcoin Bulls Return Amid Iran War Chaos

2026-03-04

More Global Trouble Ahead… What This Means for Bitcoin

2026-03-03

DOJ seizures of $580M expose how crypto investment scams scaled into shift work with quotas and scripts

2026-03-03

Bitcoin Made HUGE Moves Today…

2026-03-02
Crypto Investor News Network
Facebook Twitter Instagram TikTok
  • Contact
  • Terms & Conditions
  • Privacy Policy
  • DMCA
  • Disclouser
© 2026 - All rights are reserved.

Type above and press Enter to search. Press Esc to cancel.

bitcoin
Bitcoin (BTC) $ 73,788.00
ethereum
Ethereum (ETH) $ 2,186.63
tether
Tether (USDT) $ 1.00
bnb
BNB (BNB) $ 663.50
xrp
XRP (XRP) $ 1.46
usd-coin
USDC (USDC) $ 0.999993
solana
Solana (SOL) $ 92.99
tron
TRON (TRX) $ 0.287519
dogecoin
Dogecoin (DOGE) $ 0.103747
staked-ether
Lido Staked Ether (STETH) $ 2,265.05