• News
    • Bitcoin
    • Altcoins
    • Blockchain
    • DeFi
    • Regulation
    • Scams
  • NFT
  • Metaverse
  • Analysis
  • Learn
  • Videos
  • Blogs
  • Market Cap
  • Shop
What's Hot

What is Proof-of-Authority (POA) Consensus in Blockchain?

2025-05-09

What Is Proof-of-Stake (PoS)? Guide to Blockchain Consensus for Beginners

2025-05-09

ZachXBT reveals Coinbase users lost another $45M in a week to ongoing social engineering scams

2025-05-07

Subscribe to Updates

Get the latest creative news from FooBar about art, design and business.

Facebook Twitter Instagram
Crypto Investor News Network
  • News
    • Bitcoin
    • Altcoins
    • Blockchain
    • DeFi
    • Regulation
    • Scams
  • NFT

    All Eyes on Art: Upcoming Collections to Watch the Week of February 4

    2025-02-05

    Creator of rabbit AI assistant has hidden NFT past

    2024-05-02

    Ethereum tops daily NFT sales at US$7 mln, ends weakest month of 2024

    2024-05-02

    Top NFT Airdrops and Giveaways for May 2024

    2024-05-02

    Casio Launches NFT Collection Celebrating 50th Anniversary

    2024-05-01
  • Metaverse

    Shib: The Metaverse – Part of the Expanding Shiba Inu Ecosystem

    2025-01-03

    Experience to Earn: Everdome’s Metaverse Frontier

    2024-12-30

    Beyond Bots: Meta Motivo and the Dawn of Humanlike Digital Life

    2024-12-13

    Exploring NetVRk: What Is Behind This AI-Driven Virtual Universe?

    2024-10-28

    Council of Europe Highlights Metaverse’s Impact on Privacy and Democracy

    2024-09-05
  • Analysis

    Crypto Exchange Coinbase Lists New DeFi Altcoin Project Built on Base Blockchain

    2023-12-13

    Ethereum Price Bears Keep Pushing, Why Decline Isn’t Over Yet

    2023-12-13

    Trader Bullish on Cosmos (ATOM), Says One Dogecoin Rival Setting Up for Next Leg Up – Here’s His Outlook

    2023-12-13

    AVAX Price Pumps 50% and Dumps 15%, Why Uptrend Is Still Strong

    2023-12-13

    Top Trader Predicts Parabolic Rally for Solana Competitor – Here’s His Upside Target

    2023-12-13
  • Learn

    What is Proof-of-Authority (POA) Consensus in Blockchain?

    2025-05-09

    What Is Proof-of-Stake (PoS)? Guide to Blockchain Consensus for Beginners

    2025-05-09

    What is a Layer-1 (L1) Blockchain? L1 Problems & Future

    2025-05-03

    What is a Layer-2 (L2) Blockchain Solution? Types & Problems They Solve

    2025-05-02

    What Is a Layer-0 Blockchain Protocol?

    2025-05-02
  • Videos

    Bitcoin Surges as U.S. & China Flood Markets with Liquidity

    2025-05-07

    Bitcoin Won’t Be Fine, Bitcoin Will Be Fine

    2025-05-07

    Bitcoin PUMPS Ahead of FOMC Press Conference

    2025-05-06

    Bitcoin Core Removes The Mask

    2025-05-06

    Next CME Gap For Bitcoin to Fill (GET READY!!)

    2025-05-05
  • Blogs
  • Market Cap
  • Shop
Facebook Twitter Instagram TikTok
Crypto Investor News Network
Home»Analysis»Polkadot Experiences Correction After Reaching $5.54: What’s Next In Store?
Analysis

Polkadot Experiences Correction After Reaching $5.54: What’s Next In Store?

2023-05-29No Comments3 Mins Read
Facebook Twitter Pinterest LinkedIn Tumblr Email
Share
Facebook Twitter LinkedIn Pinterest Email

Yesterday, Polkadot (DOT) reached its weekly high at $5.54 but subsequently started a corrective phase. In the past 24 hours, DOT has managed to retain 1.8% of its overall gains during that period. On the weekly chart, DOT exhibited a 3% price increase.

However, the technical analysis suggests that bears currently have the upper hand, with buying strength and demand remaining low. Despite this, if Bitcoin continues its upward movement toward the $28,000 level, several altcoins, including DOT, may also experience positive price action.

On the flip side, if sellers dominate, DOT could break below its crucial support level, strengthening the bearish sentiment in the upcoming trading sessions. The decline in the DOT market capitalization further indicates the prevailing low buying strength at the present moment.

Polkadot Price Analysis: One-Day Chart
Polkadot
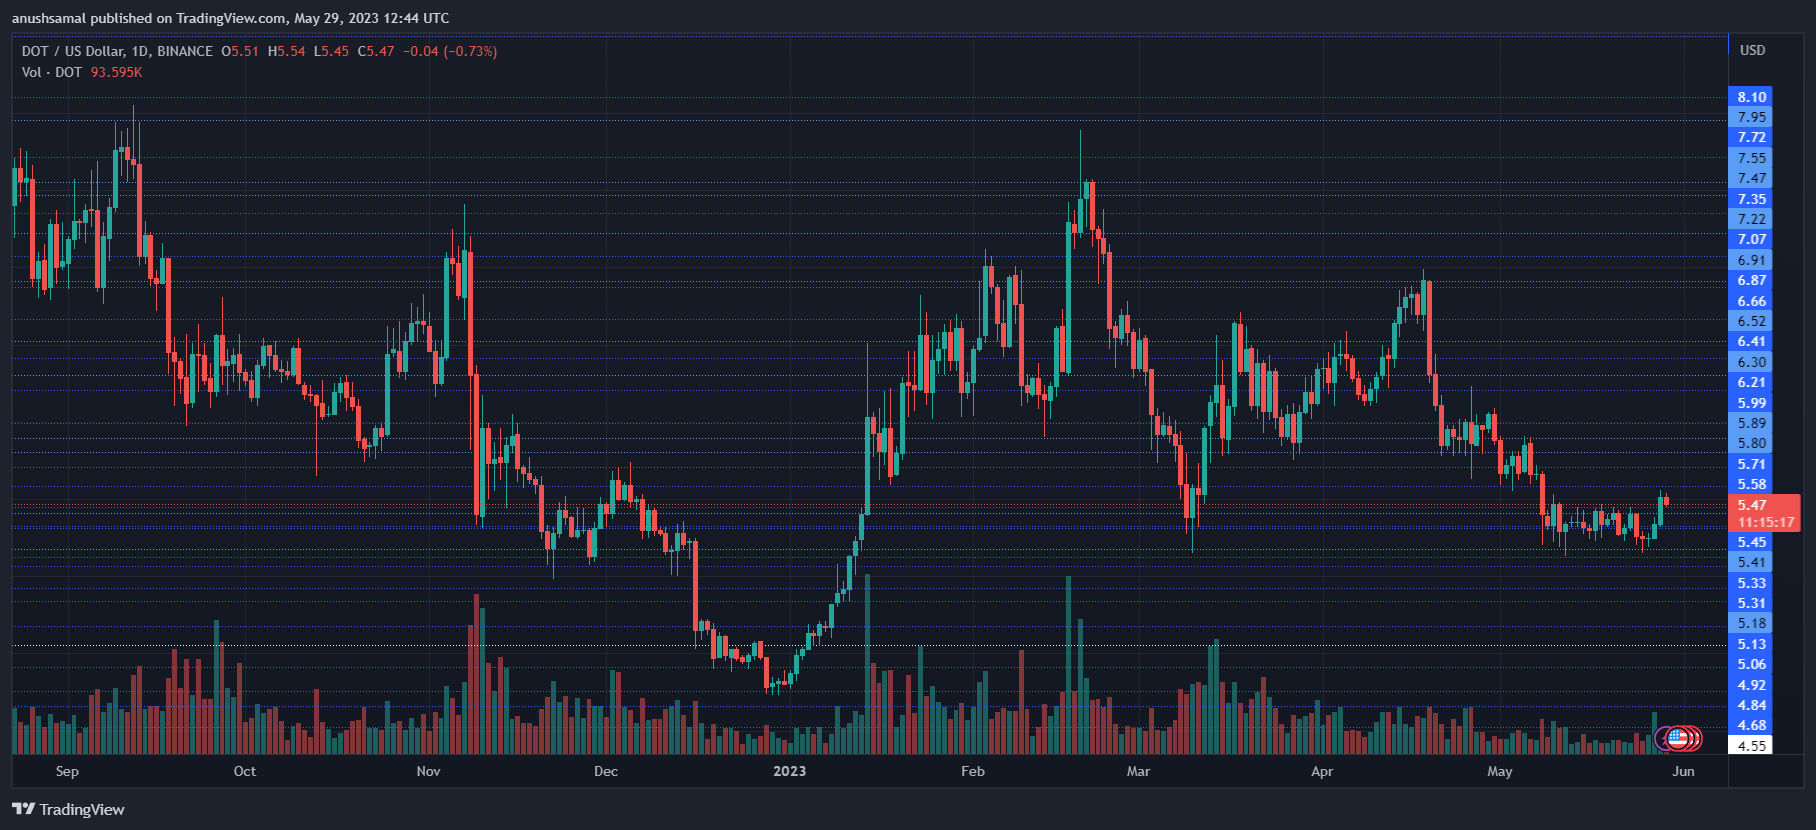
Polkadot was priced at $5.47 on the one-day chart | Source: DOTUSD on TradingView

At the time of writing, DOT was trading at $5.47. Following a rejection at the $5.54 level, the altcoin has experienced a retracement on its chart.

The overhead resistance for DOT is currently positioned at $5.58. If the altcoin manages to surpass this resistance level, it could potentially reach $5.80. Despite the price correction, DOT has thus far maintained a position above the crucial support level of $5.40.

However, if sellers gain momentum, the price may drop below the vital support level of $5.40 and trade around $5.30. The trading volume of DOT in the previous session was bearish, indicating a decline in demand driven by the bears on the daily chart.

Technical Analysis
Polkadot
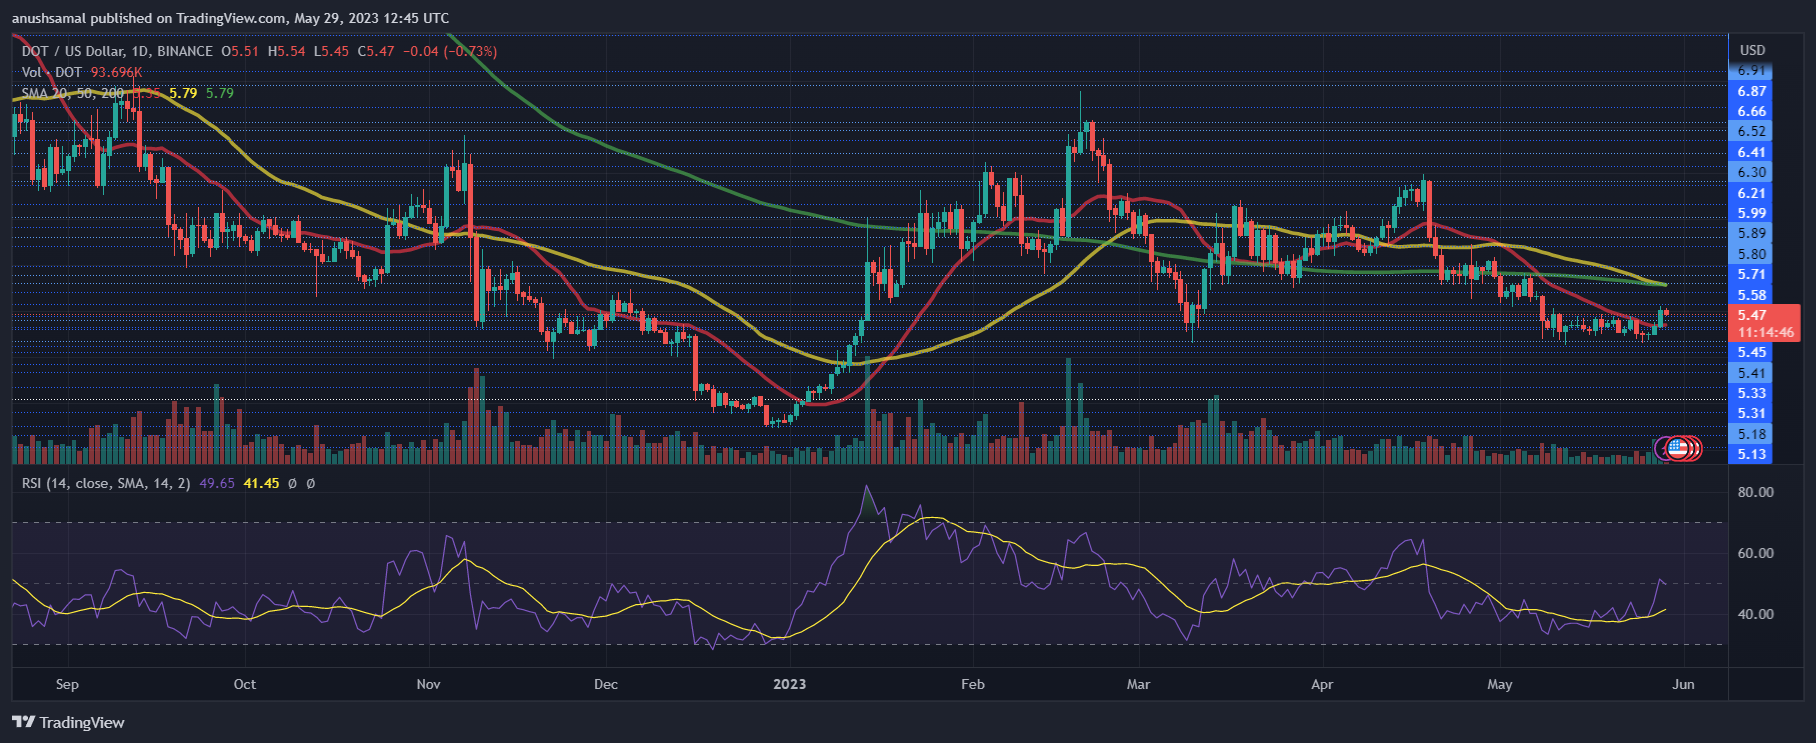
Polkadot noted a downtick in buying strength on the one-day chart | Source: DOTUSD on TradingView

Throughout the month of May, DOT has experienced minimal demand on its chart. Although the Relative Strength Index (RSI) displayed signs of recovery initially, the depreciation of DOT led to a decrease in demand.

See also  Vice President Kamala Harris Reaching Out to Coinbase and Others To Develop Close Ties With Crypto: Report

This suggests that buying strength did not enter the positive zone. Furthermore, the DOT price moved below the 20-Simple Moving Average (SMA) line, indicating that sellers have been driving the price momentum in the market.

If there is a slight increase in demand in the upcoming trading sessions, DOT may attempt to trade above the 20-SMA line, providing an opportunity for the bulls to regain control over the price.
Polkadot
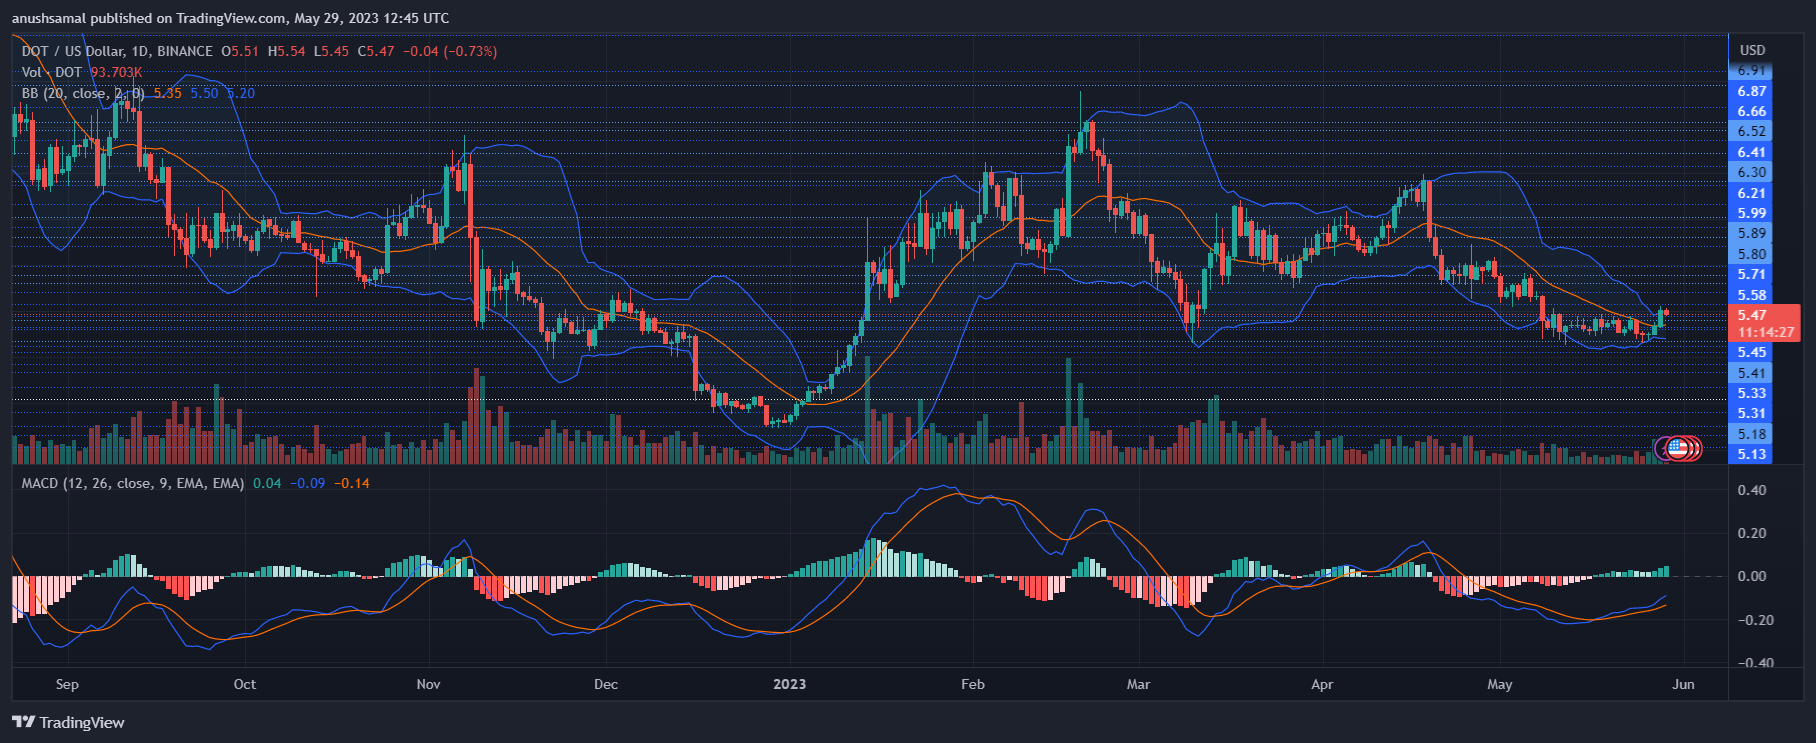
Polkadot displayed increased buy signals on the one-day chart | Source: DOTUSD on TradingView

Although demand for Polkadot has declined, the chart still displays buy signals, suggesting the potential for a price increase. These buy signals are accompanied by an increase in demand, indicating a positive outlook.

The Moving Average Convergence Divergence (MACD) indicator, which reflects price momentum and trend changes, shows green histograms tied to buy signals.

Additionally, the Bollinger Bands, which measure price volatility and fluctuation, are constricted, suggesting that Polkadot may experience significant volatility in the upcoming trading sessions.

Featured Image From UnSplash, Charts From TradingView.com

Correction Experiences Polkadot Reaching store Whats
Share. Facebook Twitter Pinterest LinkedIn Tumblr Email

Related Posts

Bitcoin Investors…Prepare For What’s Coming Next

2025-04-24

💥 WHY TESLA IS ABOUT TO POP! 🚀💸 What’s Next? 🤔

2025-03-23

Bitcoin, Stocks, Gold, and Houses (Store of Value)

2025-02-20

Is Bitcoin Really The Perfect Store of Value?

2025-02-06
Add A Comment

Leave A Reply Cancel Reply

Top Posts
DeFi

DeFi Platform Arcadia Finance Exploited for $455,000 as TVL Slumps 76%

2023-07-10

Reports are emerging that the decentralized finance (DeFi) platform Arcadia Finance may have become the…

Videos

Crypto Wallets Explained: How to Choose the Right Wallet for Your Digital Assets

2023-04-05

Welcome to CINN Crypto Investor News Network – your go-to source for the latest news,…

Altcoins

Tron [TRX] leads in key metric, but will its price react accordingly

2023-03-20

Tron beats rival blockchain networks by garnering the highest daily active user count. TRX showed…

Subscribe to Updates

Get the latest news and Update from CINN about Crypto, Metaverse and NFT.

Editors Picks

What is Proof-of-Authority (POA) Consensus in Blockchain?

2025-05-09

What Is Proof-of-Stake (PoS)? Guide to Blockchain Consensus for Beginners

2025-05-09

ZachXBT reveals Coinbase users lost another $45M in a week to ongoing social engineering scams

2025-05-07

Bitcoin Surges as U.S. & China Flood Markets with Liquidity

2025-05-07
Crypto Investor News Network
Facebook Twitter Instagram TikTok
  • Contact
  • Terms & Conditions
  • Privacy Policy
  • DMCA
  • Disclouser
© 2025 - All rights are reserved.

Type above and press Enter to search. Press Esc to cancel.

bitcoin
Bitcoin (BTC) $ 104,415.98
ethereum
Ethereum (ETH) $ 2,503.29
tether
Tether (USDT) $ 1.00
xrp
XRP (XRP) $ 2.37
bnb
BNB (BNB) $ 658.33
solana
Solana (SOL) $ 174.22
usd-coin
USDC (USDC) $ 1.00
dogecoin
Dogecoin (DOGE) $ 0.233685
cardano
Cardano (ADA) $ 0.800994
tron
TRON (TRX) $ 0.26235
bitcoin
Bitcoin (BTC) $ 104,415.98
ethereum
Ethereum (ETH) $ 2,503.29
tether
Tether (USDT) $ 1.00
xrp
XRP (XRP) $ 2.37
bnb
BNB (BNB) $ 658.33
solana
Solana (SOL) $ 174.22
usd-coin
USDC (USDC) $ 1.00
dogecoin
Dogecoin (DOGE) $ 0.233685
cardano
Cardano (ADA) $ 0.800994
tron
TRON (TRX) $ 0.26235