A popular crypto analyst thinks Bitcoin (BTC) could be gearing up for a “parabolic advance” to a new all-time high.
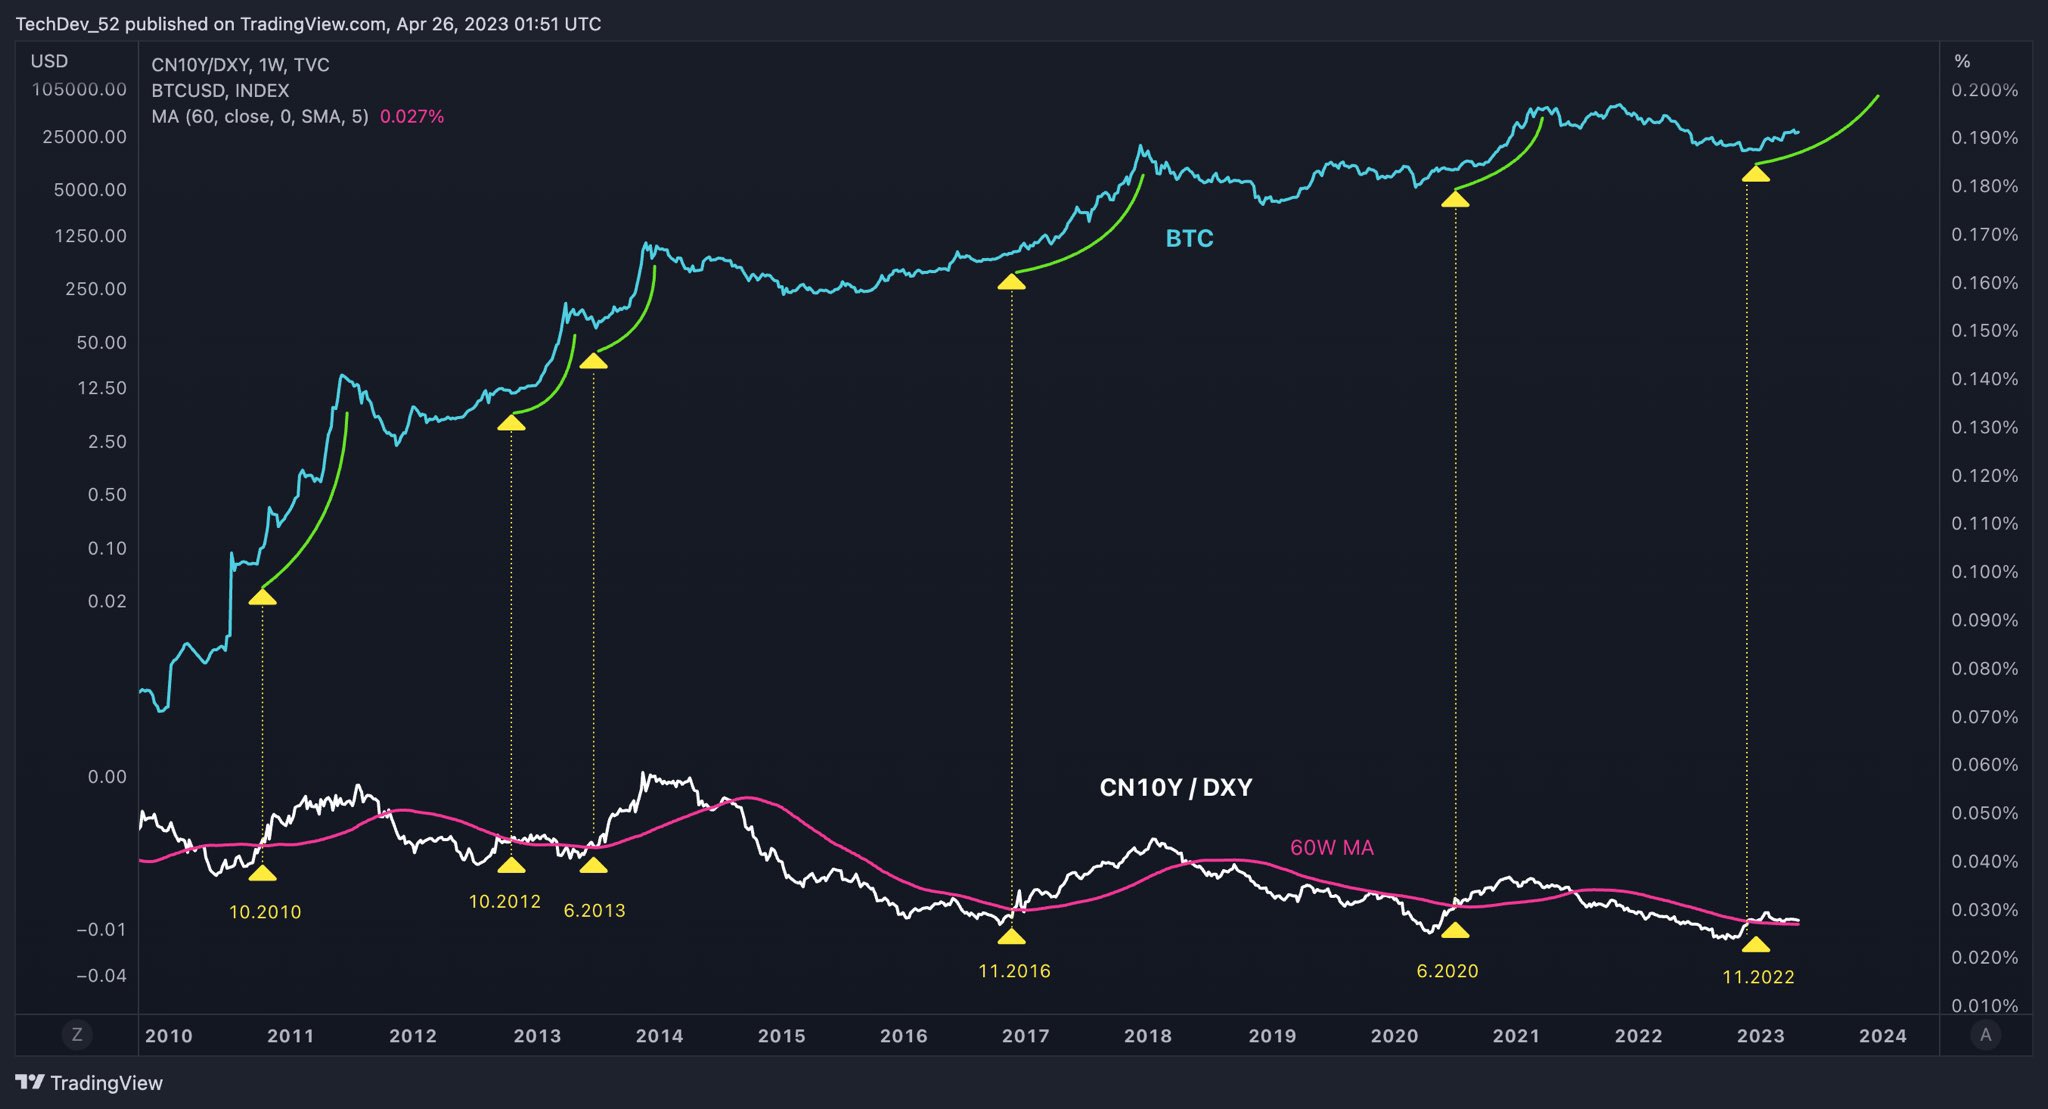
The pseudonymous analyst TechDev tells his 409,800 Twitter followers that Bitcoin tends to follow global cycles of liquidity, which he portrays with a chart that pits Chinese 10-year bonds (CN10Y) against the US dollar index (DXY).
According to the analyst, the CN10Y/DXY chart is now flashing a signal that has historically marked the beginning of fresh Bitcoin bull runs.
“The yellow arrows aren’t halving dates. They’re the liquidity signals which preceded each parabolic advance to new highs in Bitcoin.”

TechDev explains that the specific liquidity event is the CN10Y/DXY breaking over its 60-week moving average (MA).
“Has correlated with China’s credit impulse and historically led the ~3.5 global liquidity cycle. This ratio appears a rotated version of BTC’s chart.”
The analyst also says he’s keeping a close watch on the CN10Y/DXY chart as it is within the realm of possibility that it could break below the 60-week moving average, which would invalidate the signal.
Bitcoin is trading at $28,037 at time of writing. The top-ranked crypto asset by market cap is down more than 2% in the past 24 hours but up nearly 2.4% in the past week.
Earlier this month, TechDev told his Twitter followers that multiple technical indicators suggest that Bitcoin could be mimicking its 2015 bull market, a cycle that saw BTC rally from less than $200 to $20,000 in about two years.
Don’t Miss a Beat – Subscribe to get crypto email alerts delivered directly to your inbox
Check Price Action
Follow us on Twitter, Facebook and Telegram
Surf The Daily Hodl Mix
Generated Image: Midjourney

