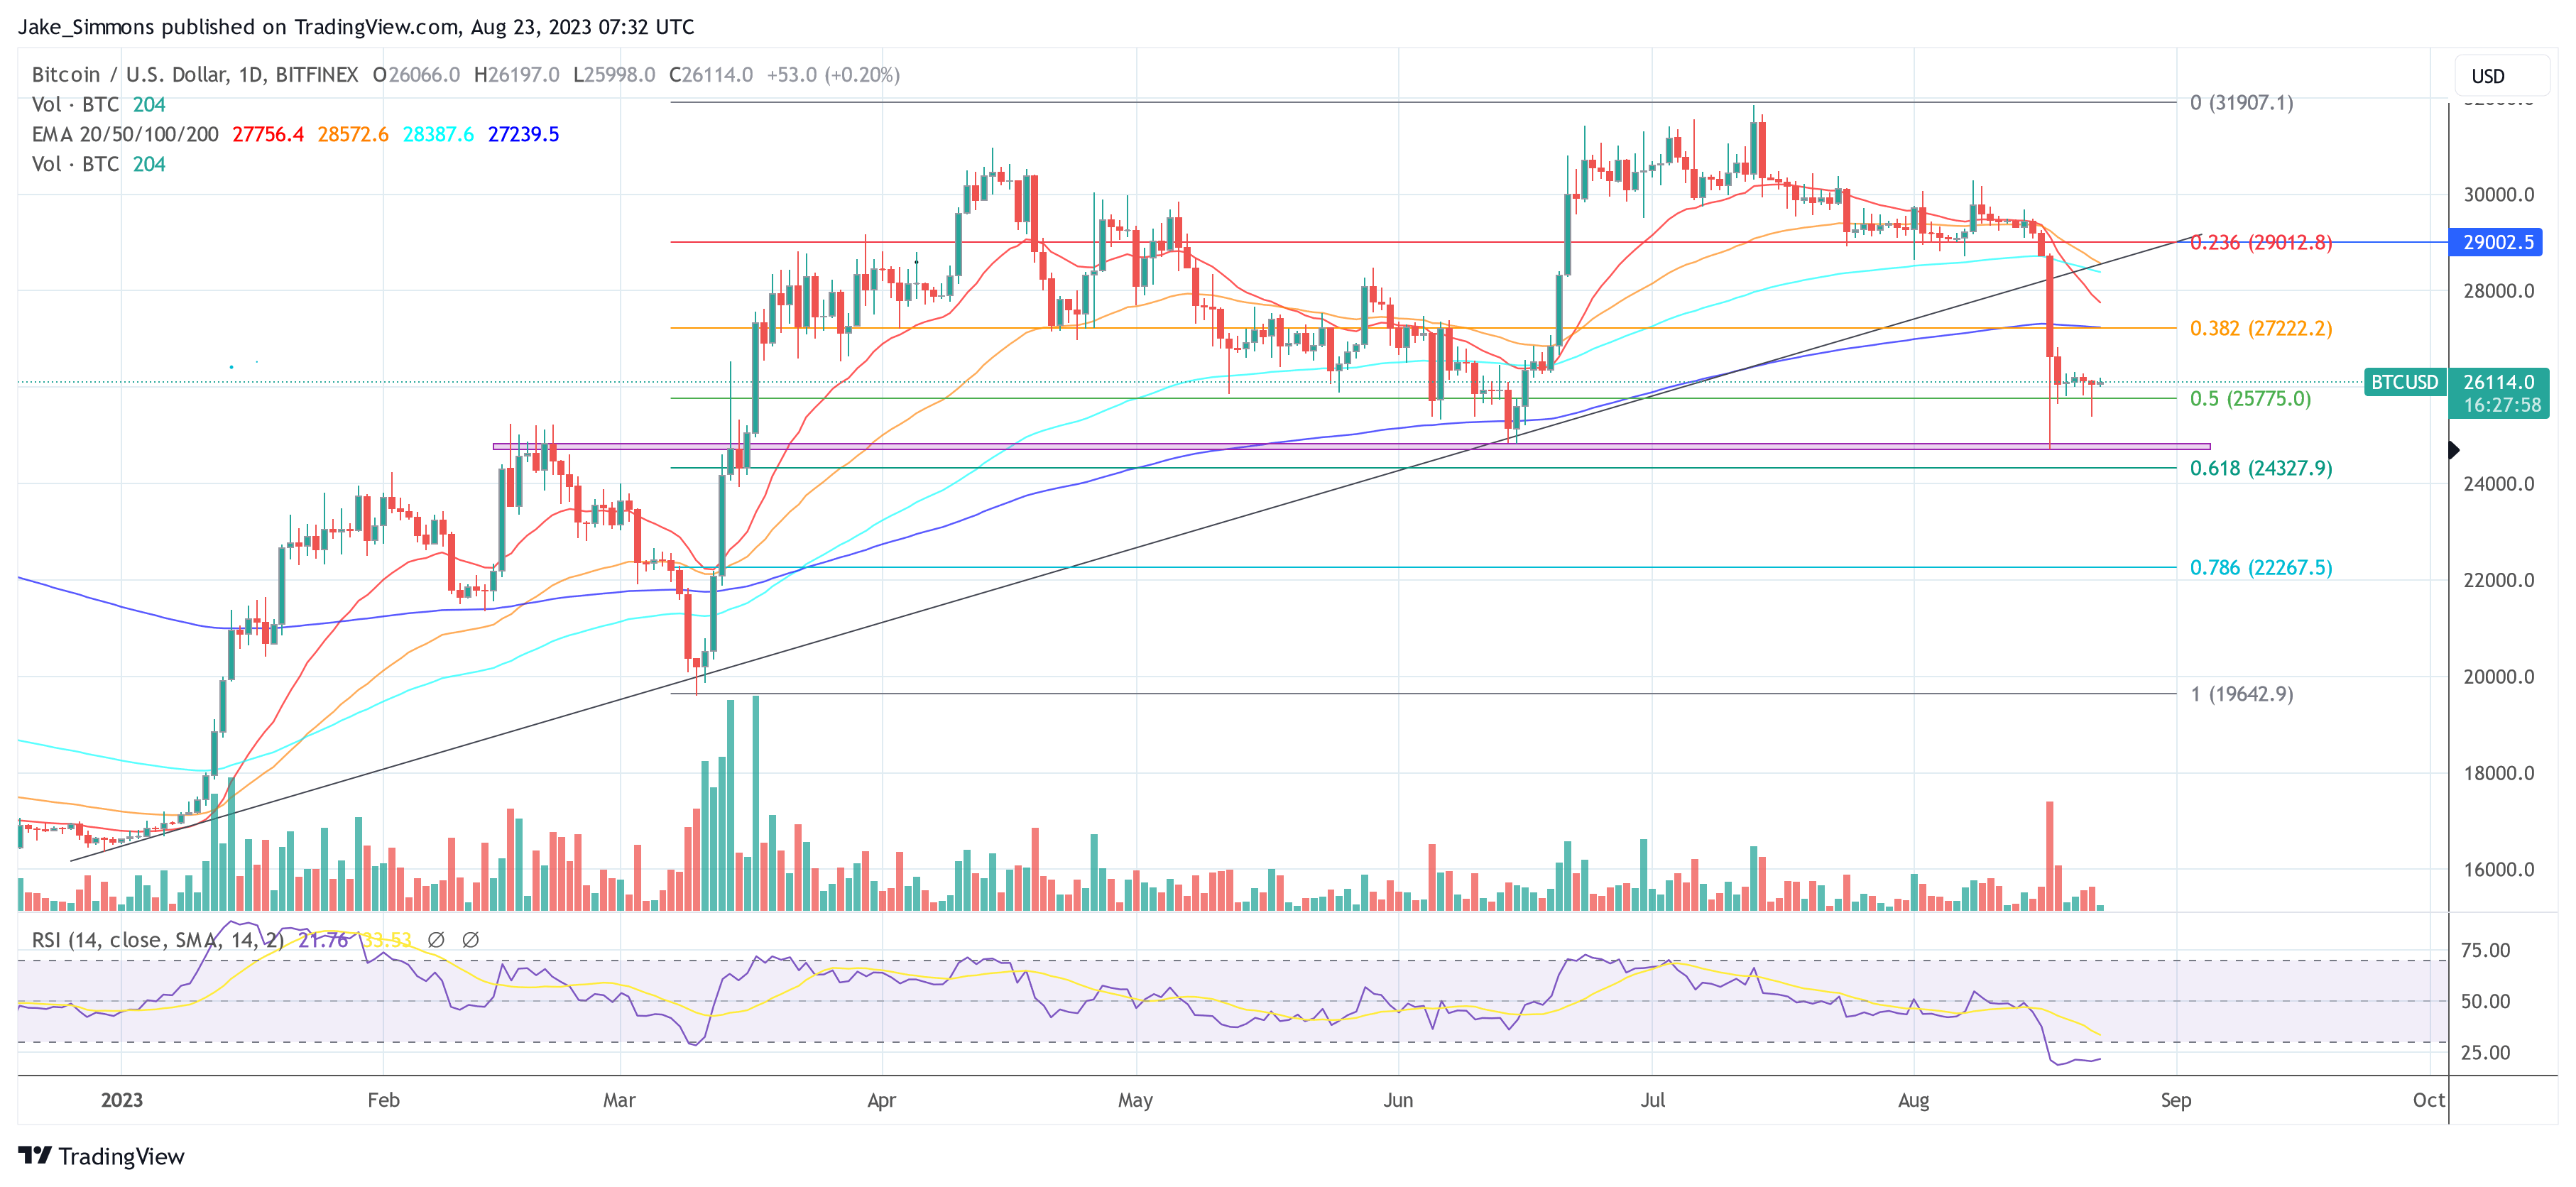
As the Bitcoin market navigates the choppy waters around $26,000, there are several metrics to keep an eye on. After hitting a low of $25,374 yesterday, the bulls have managed to push the price back up, although the market remains in a vulnerable state following last Thursday’s price crash.
Currently, the Fear and Greed Index for Bitcoin sits at 37, which is indicative of strong fear permeating the market. Typically, such a low level on this index suggests that market participants are apprehensive about the near-term future, often leading to a self-fulfilling prophecy of sorts where the selling pressure increases.
An In-Depth Look At Bitcoin CVDs & Delta
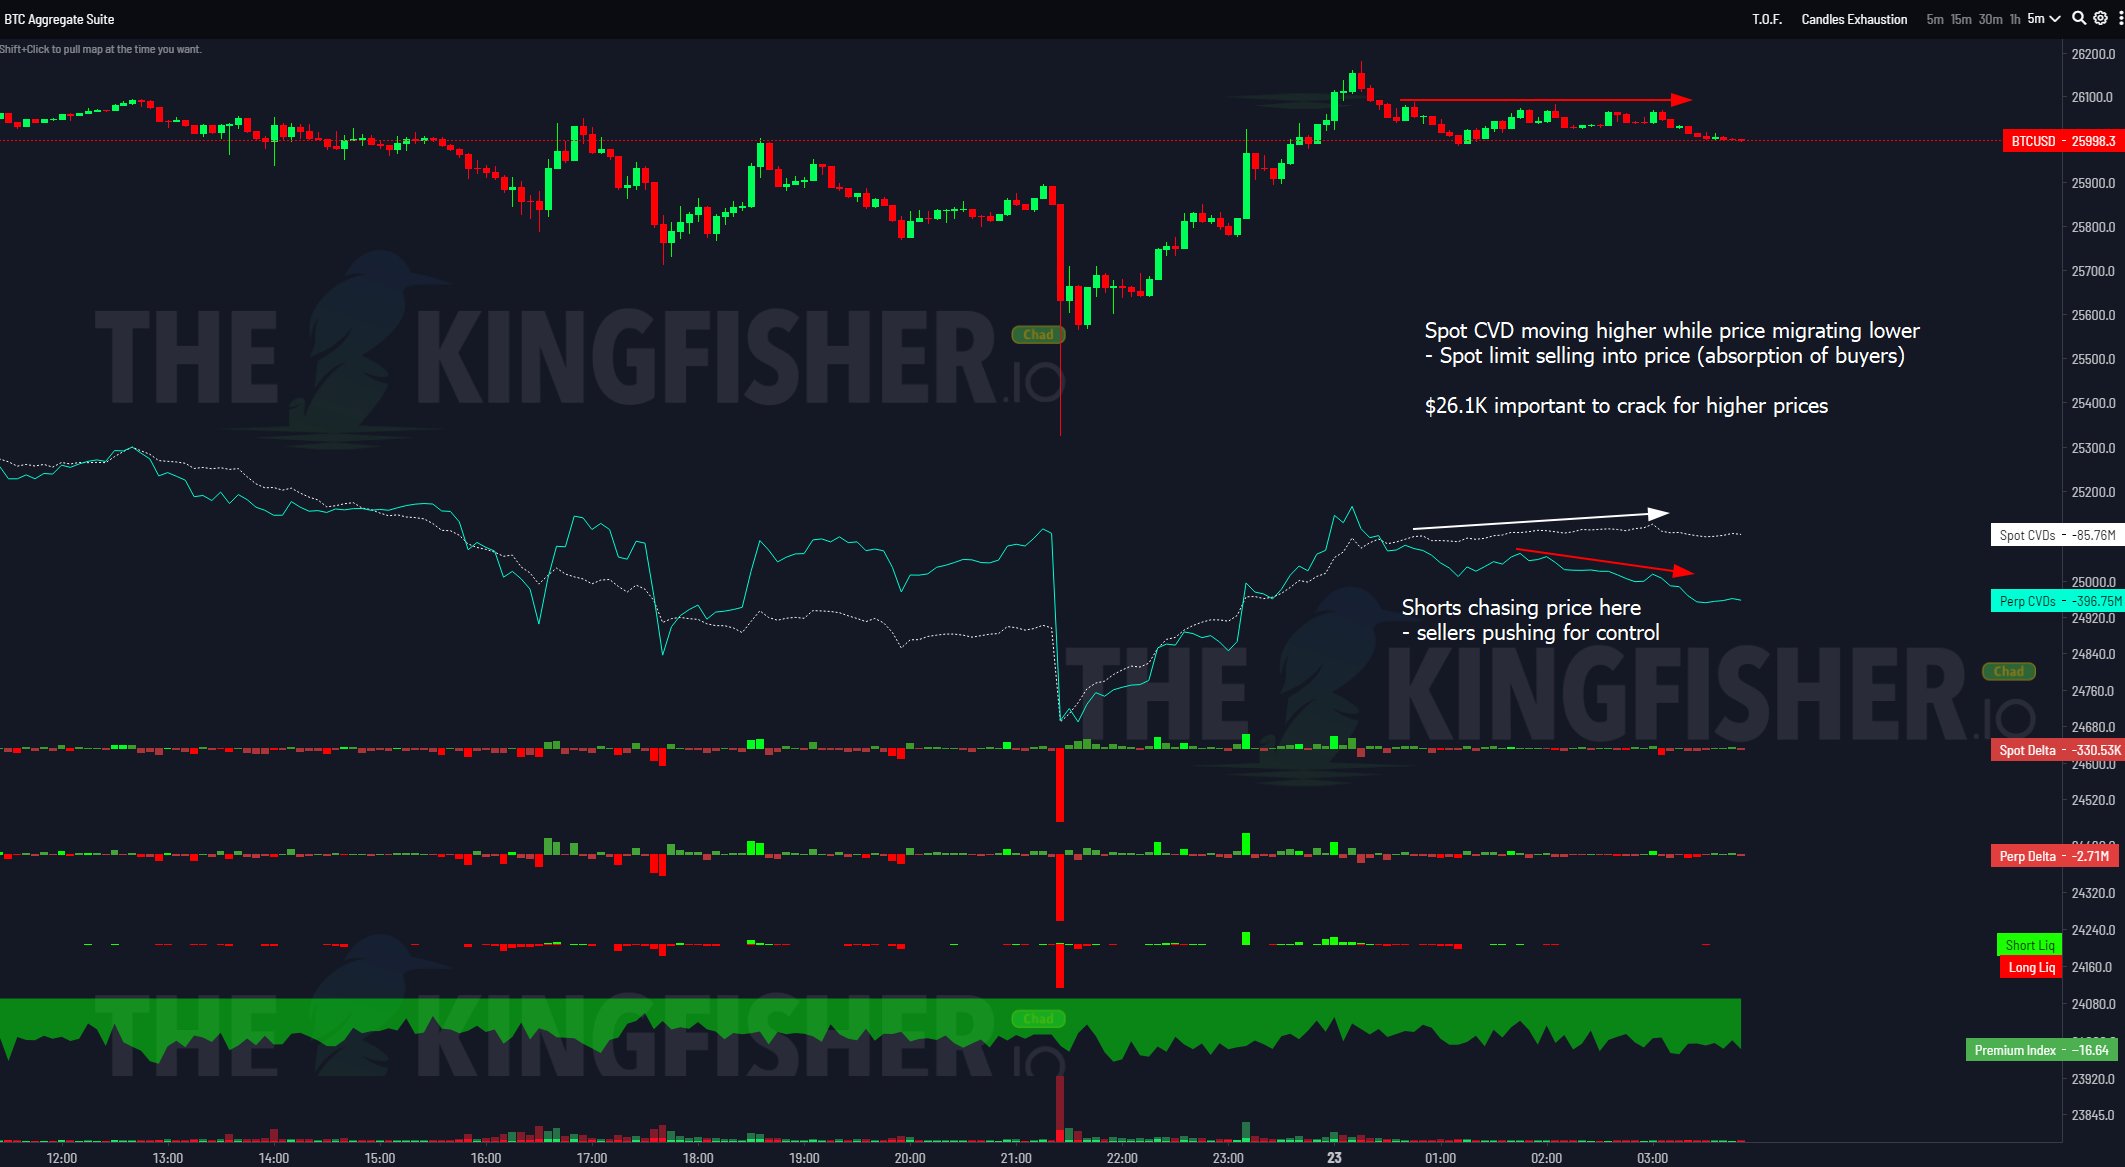
Renowned analyst Skew has highlighted the role of Cumulative Volume Delta (CVD) in understanding the current market dynamics today. “BTC Aggregate CVDs & Delta reveal limit spot sellers here with shorts pushing for control.” This means that even as traders are looking to buy at market prices (takers), those willing to sell are setting limits, adding a ceiling to any short-term bullish momentum.
The specific price point to note here is $26,100. “This level has acted as a magnet for limit sellers,” Skew notes, “and is backed by the pattern seen in spot CVD versus price so far.” In other words, spot takers are being absorbed by limit sellers at this price, constraining upward movement.

Perpetual CVD (Perp CVD) also deserves attention as it “moves lower in line with longs closing out and new shorts coming in.” This suggests that traders are not only covering their long positions but also opening new short positions, in line with the current bearish price action.
Examining specific exchanges like Binance and Bybit gives further granularity to the analysis. According to Skew, “Longs got rinsed in that sweep below $25,800, thereby marking that level as a key pivot point.” Open Interest (OI) on Binance saw a reduction of 6,000 BTC, and Bybit OI was down by 3,000 BTC – all in long positions that were liquidated.
The liquidation of longs at these levels presents a clear risk for any bullish scenarios. “Clear risk for longs is below $25,800,” Skew asserts, making it an essential level to watch for traders who are net long.
MacroCRG, a renowned market analyst, added to the analysis that large amount of longs were liquidated again during yesterday’s BTC dip: “More pain for #Bitcoin longs as another $300M+ of open interest was wiped out overnight by a downside sweep. When will it end?”
However, there could be a silver lining, as Skew puts it: “Likely to see apes rage shorting this soon.” But so far, Bitcoin’s open interest (OI) remains flat after Thursday’s flush. OI currently stands at $10.88 billion (after being above $14 billion).

BTC’s OI-weighted funding rate has already turned positive again at +0.0060. If the value turns negative for several days, as it did before the March 2023 rally, it could be a sign that a short squeeze is on the cards. However, after Thursday’s crash, the metric remained in negative territory only for a short time.

BTC Short-Term Holders and Velocity
On-chain specialist Axel Adler Jr. points out that the short-term Bitcoin holders (STH) cohort has decreased their holdings by a significant 400,000 BTC. This mass exodus has put considerable selling pressure on the market, rendering many STHs “underwater” and thereby less likely to engage in bullish behavior.
Moreover, Adler emphasizes the BTC Velocity metric, stating, “At the beginning of this year, the BTC Velocity metric dropped to its minimum level.” This extremely low velocity indicates not just low volatility, but also a lack of market participant activity – a concerning sign for any imminent bullish turn. Therefore, Adler concludes:
Taking into account these two factors, as well as the fact that the STH cohort has traditionally been the primary player creating volatility in the BTC market, recovery after this drop will require more time than usual and may take an indefinite period.
At press time, BTC traded at $26,114.

Featured image from iStock, chart from TradingView.com


