• News
    • Bitcoin
    • Altcoins
    • Blockchain
    • DeFi
    • Regulation
    • Scams
  • NFT
  • Metaverse
  • Analysis
  • Learn
  • Videos
  • Blogs
  • Market Cap
  • Shop
What's Hot

This Bitcoin Reset Is Setting Up the Next Big Move

2026-02-11

What Is TRON (TRX)? How It Works, History, Roadmap

2026-02-10

Bitcoin Has Never Been This Undervalued…

2026-02-10

Subscribe to Updates

Get the latest creative news from FooBar about art, design and business.

Facebook Twitter Instagram
Crypto Investor News Network
  • News
    • Bitcoin
    • Altcoins
    • Blockchain
    • DeFi
    • Regulation
    • Scams
  • NFT

    Bitcoin Just Hit an All-Time High. Nobody Cares

    2025-09-11

    All Eyes on Art: Upcoming Collections to Watch the Week of May 27

    2025-09-11

    Bitcoin Vegas Belongs to the Suits Now

    2025-09-11

    NFC Summit Lisbon Founder on Evolving the Event and Weathering the Market

    2025-09-11

    All Eyes on Art: Upcoming Collections to Watch the Week of June 3

    2025-09-10
  • Metaverse

    Shib: The Metaverse – Part of the Expanding Shiba Inu Ecosystem

    2025-01-03

    Experience to Earn: Everdome’s Metaverse Frontier

    2024-12-30

    Beyond Bots: Meta Motivo and the Dawn of Humanlike Digital Life

    2024-12-13

    Exploring NetVRk: What Is Behind This AI-Driven Virtual Universe?

    2024-10-28

    Council of Europe Highlights Metaverse’s Impact on Privacy and Democracy

    2024-09-05
  • Analysis

    Crypto Exchange Coinbase Lists New DeFi Altcoin Project Built on Base Blockchain

    2023-12-13

    Ethereum Price Bears Keep Pushing, Why Decline Isn’t Over Yet

    2023-12-13

    Trader Bullish on Cosmos (ATOM), Says One Dogecoin Rival Setting Up for Next Leg Up – Here’s His Outlook

    2023-12-13

    AVAX Price Pumps 50% and Dumps 15%, Why Uptrend Is Still Strong

    2023-12-13

    Top Trader Predicts Parabolic Rally for Solana Competitor – Here’s His Upside Target

    2023-12-13
  • Learn

    What Is TRON (TRX)? How It Works, History, Roadmap

    2026-02-10

    6 Indicators That Actually Work

    2026-02-10

    Can My Crypto Go Negative? Margin Trading, Liquidation & Protection

    2026-02-04

    What Beginners Should Know in 2026

    2026-02-04

    What Is a Node in Cryptocurrency? How They Store, Verify, and Protect the Blockchain

    2026-02-03
  • Videos

    This Bitcoin Reset Is Setting Up the Next Big Move

    2026-02-11

    Bitcoin Has Never Been This Undervalued…

    2026-02-10

    Can Bitcoin Really Fall to $50,000?

    2026-02-09

    The Evidence: Institutions Buying YOUR Bitcoin

    2026-02-09

    Whales Are Buying 🐋 $4.7B Is the Trap 🚨 Follow the Money 💰

    2026-02-09
  • Blogs
  • Market Cap
  • Shop
Facebook Twitter Instagram TikTok
Crypto Investor News Network
Home»Bitcoin»Did This Historical Line Act As Support Again?
Bitcoin

Did This Historical Line Act As Support Again?

2023-05-29No Comments4 Mins Read
Facebook Twitter Pinterest LinkedIn Tumblr Email
Share
Facebook Twitter LinkedIn Pinterest Email

Bitcoin on-chain data suggests a historical support line may have helped the coin once again as the asset has recovered toward $28,000 today.

Bitcoin Short-Term Holder Cost Basis May Still Be Active As Support

According to data from the on-chain analytics firm Glassnode, the BTC price approached the cost basis of the short-term holders recently. The relevant indicator here is the “realized price,” which is a metric derived from the “realized cap.”

The realized cap refers to a capitalization model for Bitcoin that says that the value of each coin in the circulating supply is not the current spot price, but the price at which it was last transacted on the blockchain.

In this way, the model accounts for the price at which each investor acquired their coins. That is, their “cost basis.” When the realized cap is divided by the number of coins in circulation (to find a sort of average value), the aforementioned realized price emerges.

Related Reading: Bitcoin Exchange Inflows Mostly Coming From Loss Holders, Weak Hands Exiting?

This realized price signifies the average value at which each holder in the market bought their coins. The metric can also be defined for only partial segments of the market, like the “short-term holders” (STHs), in which case, the indicator will tell us about the average cost basis among this group only.

The STHs are all those investors who bought their coins less than 155 days ago. The BTC holders outside this group are termed the “long-term holders” (LTHs).

Now, here is a chart that shows the trend in the Bitcoin realized price for the STHs over the past couple of years:

See also  Thruster Boosts DeFi with Support for Juice’s USDB/ETH Vault

Bitcoin Short-Term Holder Realized Price

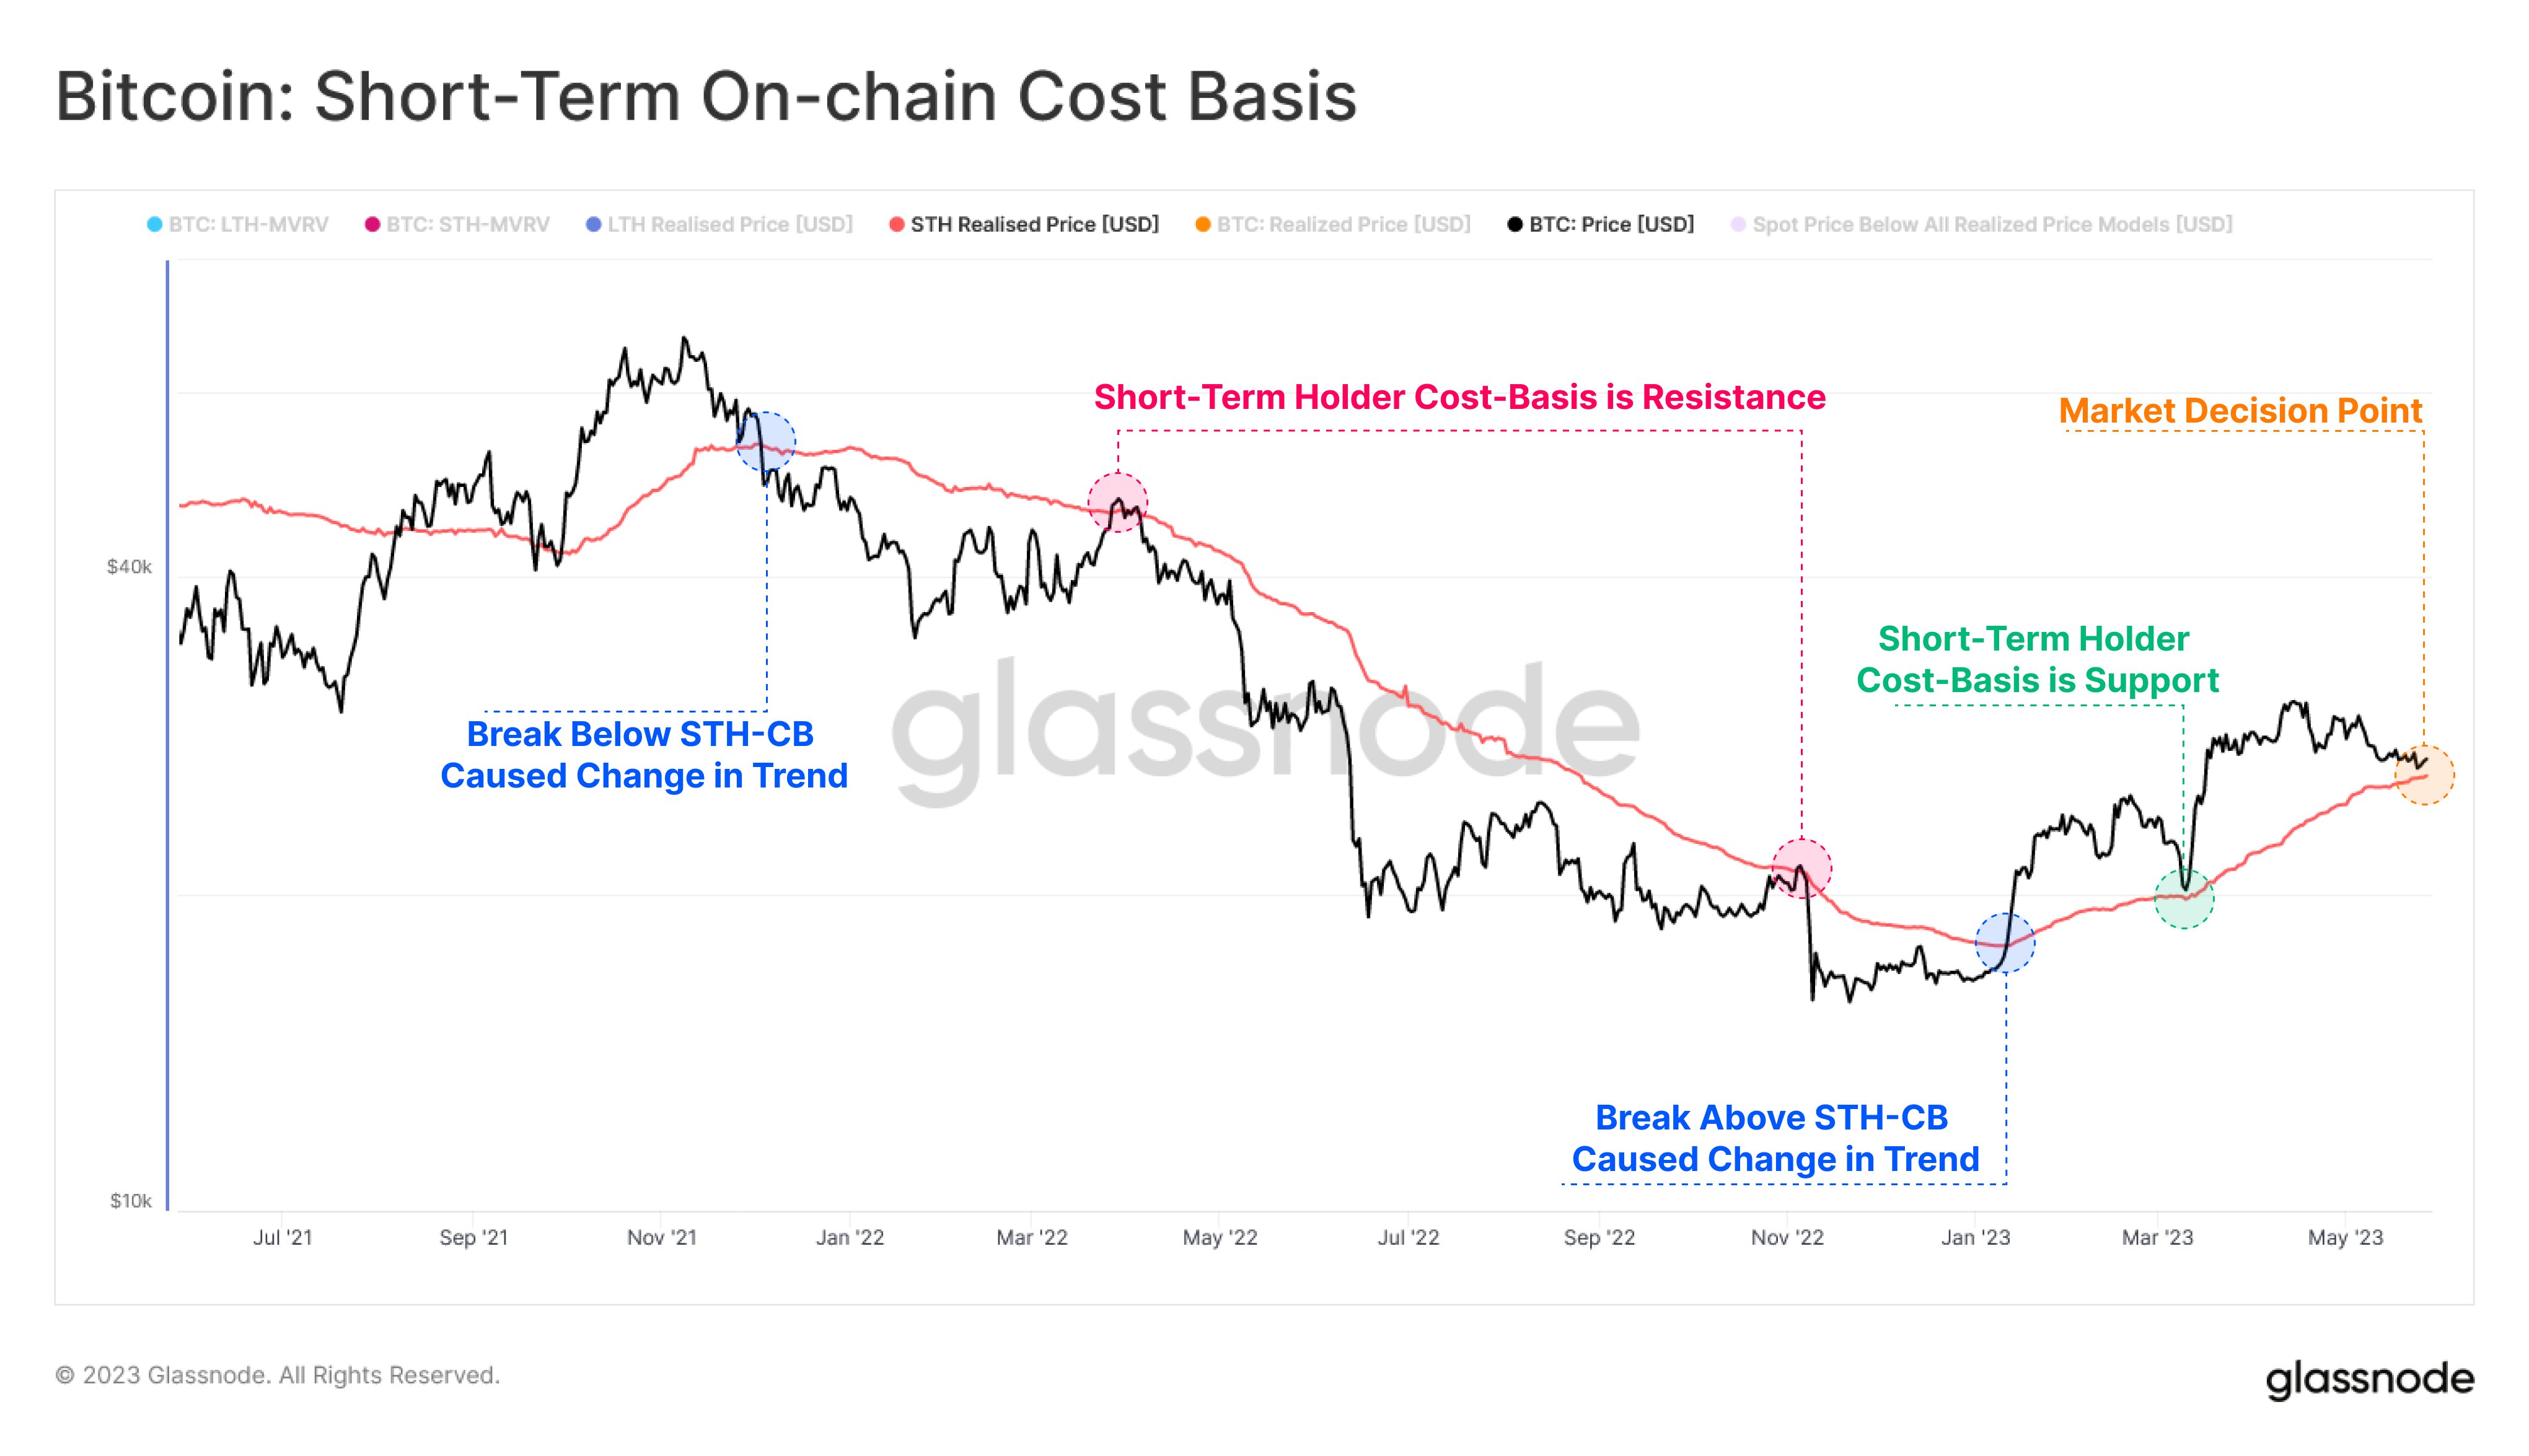
The value of the metric seems to have been climbing in recent days | Source: Glassnode on Twitter

In the above graph, Glassnode has marked the various instances where the Bitcoin STH realized price has apparently interacted with the spot price of the asset. Back when the 2021 bull run topped out in November, the cryptocurrency’s value dropped below this indicator, signaling a change of trend.

From this point on, as the bear market took over, the STH cost basis started providing resistance to the asset. Back in January of this year, though, the price finally managed to break through this resistance as the rally began to take place.

Related Reading: Bitcoin Bulls Push BTC Back Up To $28K Amid Surging Address Activity

This break lead to another change in the wider trend, as the line seemingly turned into support for the asset. However, this isn’t an unusual pattern, as bullish periods have historically observed the metric helping the price.

Recently, Bitcoin found some struggle, as the price plunged towards the $26,000 level. The consolidation near this level meant that the price was fast approaching the STH realized price, which was slowly going up.

When Glassnode posted the chart yesterday, it described this current state as a “decision point” for the market. According to the analytics firm, a successful retest here would be a sign of strength in the bullish trend, while failure would imply weakness.

Over the past day, Bitcoin has enjoyed a rebound, with the price briefly breaking above the $28,000 level. But it may perhaps not be a coincidence that the uplift has come right as the price was nearing a retest of this historical level.

See also  Uncle Sam lists Bitcoin for sale: Should BTC holders be concerned

Naturally, a sustained move away from the STH realized price now would confirm that the level is still active as support, a sign that would be positive for the rally’s sustainability.

BTC Price

At the time of writing, Bitcoin is trading around $27,900, up 4% in the last week.

Bitcoin Price Chart

BTC has surged in the past day | Source: BTCUSD on TradingView

Featured image from iStock.com, charts from TradingView.com, Glassnode.com

act Historical line Support
Share. Facebook Twitter Pinterest LinkedIn Tumblr Email

Related Posts

The $6.6 Trillion Secret That KILLED The Clarity Act

2026-01-30

Bitcoin Breakdown, Gold Goes Parabolic, Clarity Act Collapse & Market Chaos

2026-01-26

Crypto BETRAYAL!! Coinbase KILLS The CLARITY Act!!

2026-01-20

Bitcoin to $90k, Tariff CRASH, Clarity Act, Death of Altcoins & More!

2026-01-19
Add A Comment

Leave A Reply Cancel Reply

Top Posts
DeFi

Convex Finance (CVX) up 8% Amid Call for Voting on Pool Weight: Details

2023-04-11

DeFi Investors appear to be rallying around decentralized finance (DeFi) protocol Convex Finance (CVX), which…

NFT

Industry must look past the arbitrary buying and selling of pixels

2023-08-14

Disclosure: The views and opinions expressed here belong solely to the author and do not…

Videos

50K BTC in BlackRock’s IBIT: $2 Billion Achieved!

2024-02-02

In today’s essential Bitcoin update, we delve into the CCP’s latest anti-Bitcoin propaganda, signaling heightened…

Subscribe to Updates

Get the latest news and Update from CINN about Crypto, Metaverse and NFT.

Editors Picks

This Bitcoin Reset Is Setting Up the Next Big Move

2026-02-11

What Is TRON (TRX)? How It Works, History, Roadmap

2026-02-10

Bitcoin Has Never Been This Undervalued…

2026-02-10

6 Indicators That Actually Work

2026-02-10
Crypto Investor News Network
Facebook Twitter Instagram TikTok
  • Contact
  • Terms & Conditions
  • Privacy Policy
  • DMCA
  • Disclouser
© 2026 - All rights are reserved.

Type above and press Enter to search. Press Esc to cancel.

bitcoin
Bitcoin (BTC) $ 66,200.00
ethereum
Ethereum (ETH) $ 1,920.71
tether
Tether (USDT) $ 0.999518
xrp
XRP (XRP) $ 1.35
bnb
BNB (BNB) $ 595.75
usd-coin
USDC (USDC) $ 0.999825
solana
Solana (SOL) $ 79.22
tron
TRON (TRX) $ 0.275647
jusd
JUSD (JUSD) $ 0.999053
figure-heloc
Figure Heloc (FIGR_HELOC) $ 1.03