The Bitcoin price is trading at $27,100 at the time of writing, marking a 60% decline from its all-time high of $69,000 in 2021. As the anticipation for the next bull market builds, questions arise regarding Bitcoin’s potential future prices.
While most predictions are speculative, one analyst has devised a model leveraging historical data to forecast potential tops and bottoms in Bitcoin’s price over time.
Bitcoin Price In Previous Cycles

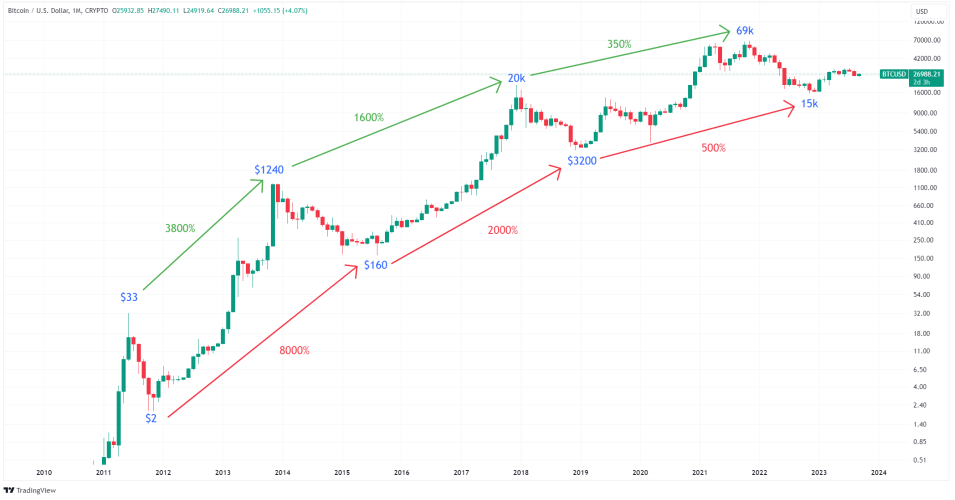
Bitcoin's prices changes since 2011. Source: BTCUSDT on TradingView
Since its inception, Bitcoin has demonstrated remarkable growth, rewarding early long-term investors substantially. This price growth is observable in measuring Bitcoin’s prices from the lows to the highs and between the highs of successive bull markets.
In 2011, the peak was $33, followed by a peak of $1240 in 2013, reflecting a 3800% increase between peaks. The subsequent peaks in 2017 and 2021 were $20,000 and $69,000, representing increases of 1,600% and 350%, respectively. Comparable levels of increase are also observed when examining the lows of different cycles.
Notably, the relative growth between cycles has diminished, possibly due to the increase in Bitcoin’s market capitalization, requiring more substantial capital to influence its price. This diminishing growth aligns with a mathematical pattern known as logarithmic regression.
Logarithmic Regression
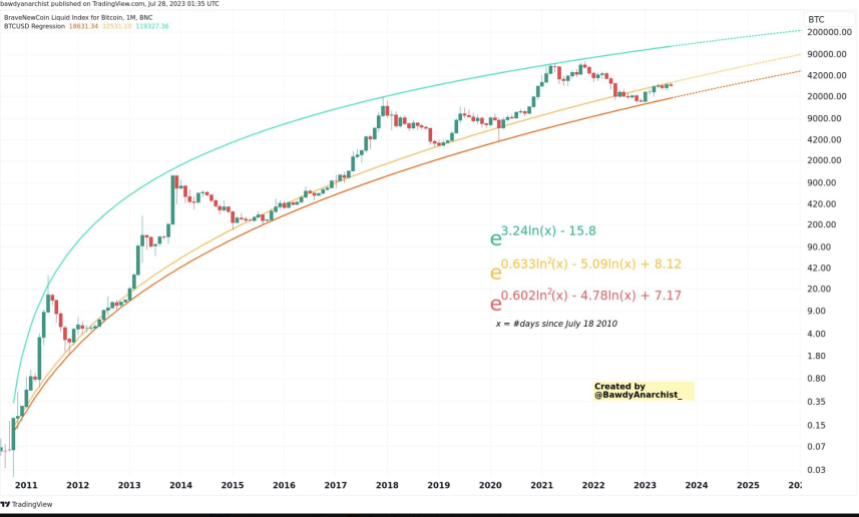
An analyst has devised various logarithmic curves on the Bitcoin chart to forecast Bitcoin’s potential tops and bottoms, utilizing time as the only input. Such models can help investors by offering a straightforward way to see potential market trends and make proactive plans in the unpredictable world of cryptocurrency.

Chart of Bitcoin's price in a channel of logistic regression curves. Source: @BawdyAnarchist_ on X
Bitcoin’s tops and bottoms typically manifest every four years, enabling the prediction of potential Bitcoin prices in upcoming cycles based on the logarithmic regression model.
Bitcoin Price Projections
- 2025-2026: Bitcoin price may peak in the third or fourth quarter of 2025 between $190,000-$200,000, before bottoming out around $70,000 the following year.
- 2029-2030: Bitcoin price may reach a top of $420,000 to $440,000 and bottom out the following year at around $230,000.
- 2033-2034: Bitcoin price may peak between $750,000-$800,000 and bottom out around $700,000 the following year.
By the late 2030s, the model begins to break down as predicted tops start falling below the predicted bottoms, potentially indicating a stabilization in Bitcoin’s price post its peak of $750,000-$800,000
Final thoughts
While models like this offer insightful projections of Bitcoin’s potential future prices, it’s important to acknowledge their limitations and the need for periodic updates with fresh data points. Numerous external factors, including but not limited to regulatory changes, technological advancements, and macroeconomic conditions, could significantly impact the model’s accuracy.
Moreover, the unprecedented nature of Bitcoin’s trajectory, having never endured a recessionary environment, implies a potential susceptibility to more substantial crashes than models might predict. Predictions should be cautiously considered with broader market analyses and trends as with any financial model.
Investment Disclaimer: The content provided in this article is for informational and educational purposes only. It should not be considered investment advice. Please consult a financial advisor before making any investment decisions. Trading and investing involve substantial financial risk. Past performance is not indicative of future results. No content on this site is a recommendation or solicitation to buy or sell securities or cryptocurrencies.
Featured image from ShutterStock, Charts from TradingView.com


