- SAND has seen a decrease in supply on exchanges after initial spikes.
- SAND’s price movement has been mixed as MVRV hits negative.
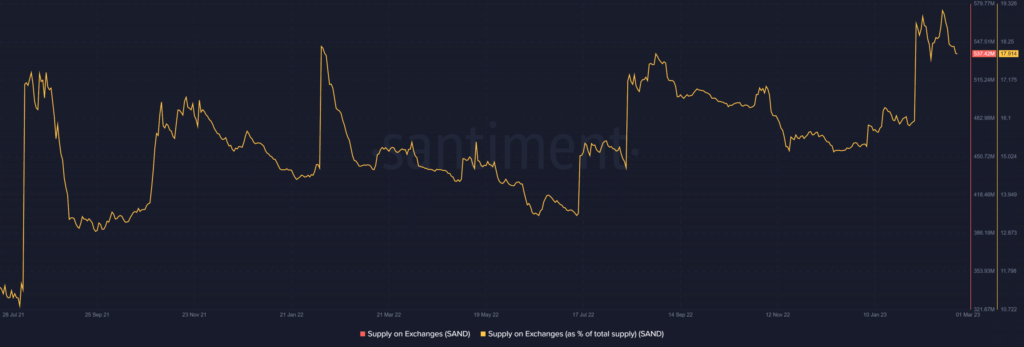
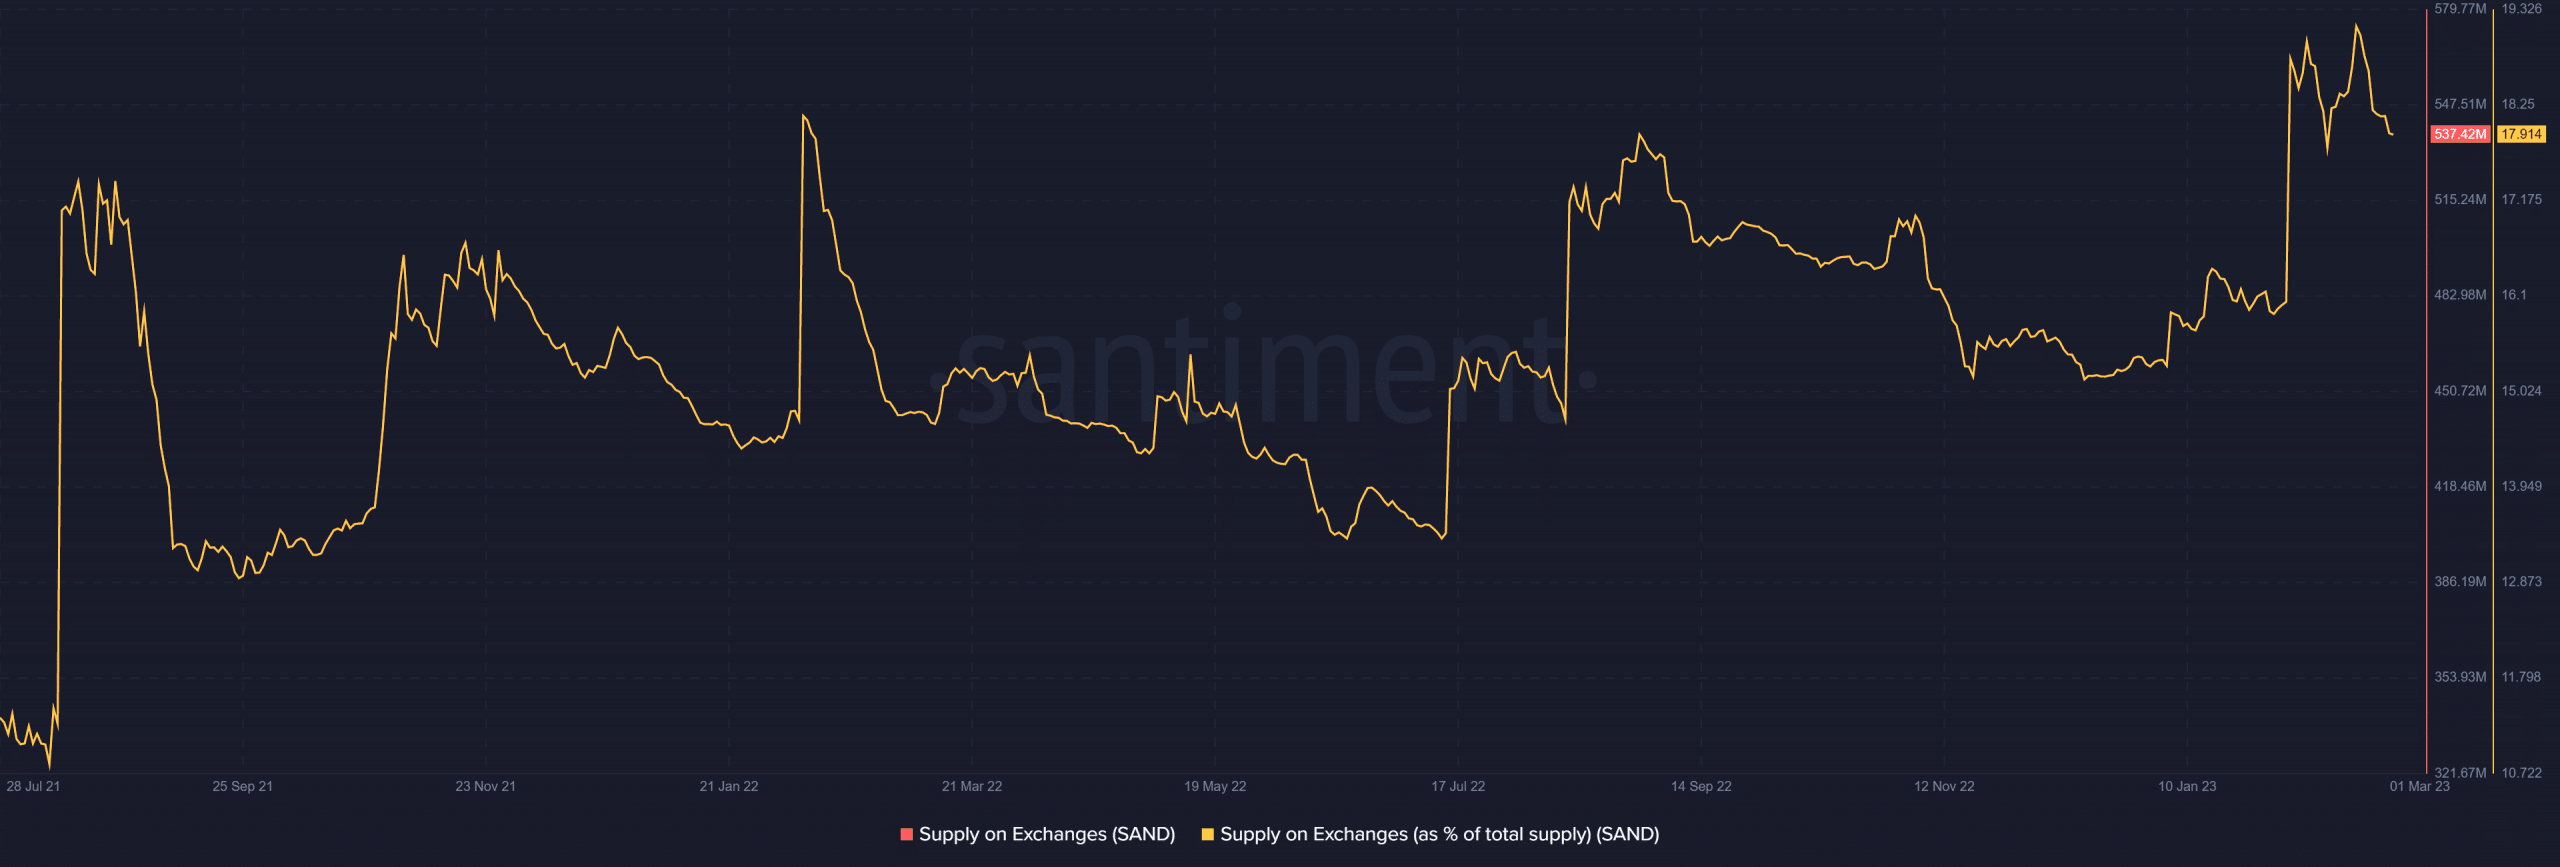
The Sandbox [SAND] investors are still figuring out where the token is headed as 20% of the total SAND supply was unlocked on 14 February. Additionally, the token supply to exchanges significantly increased just before the event. Around 560 million SANDs were pushed to the exchanges before the unlock, as seen by Supply on Exchanges on Santiment.
Source: Santiment
Read The Sandbox’s [SAND] Price Prediction 2023-24
It should be noted that the token supply to exchanges increased after the unlock. One possible explanation for the higher supply is that more investors brought their assets to these exchanges to liquidate their holdings.
As a result, despite a brief peak in the token’s value, the persistent sale has resulted in a decline in value. As of this writing, the supply on exchanges was 537.39 million, which appeared to have dropped, and it represented 17.9% of the supply.
Outflow dominates SAND’s netflow
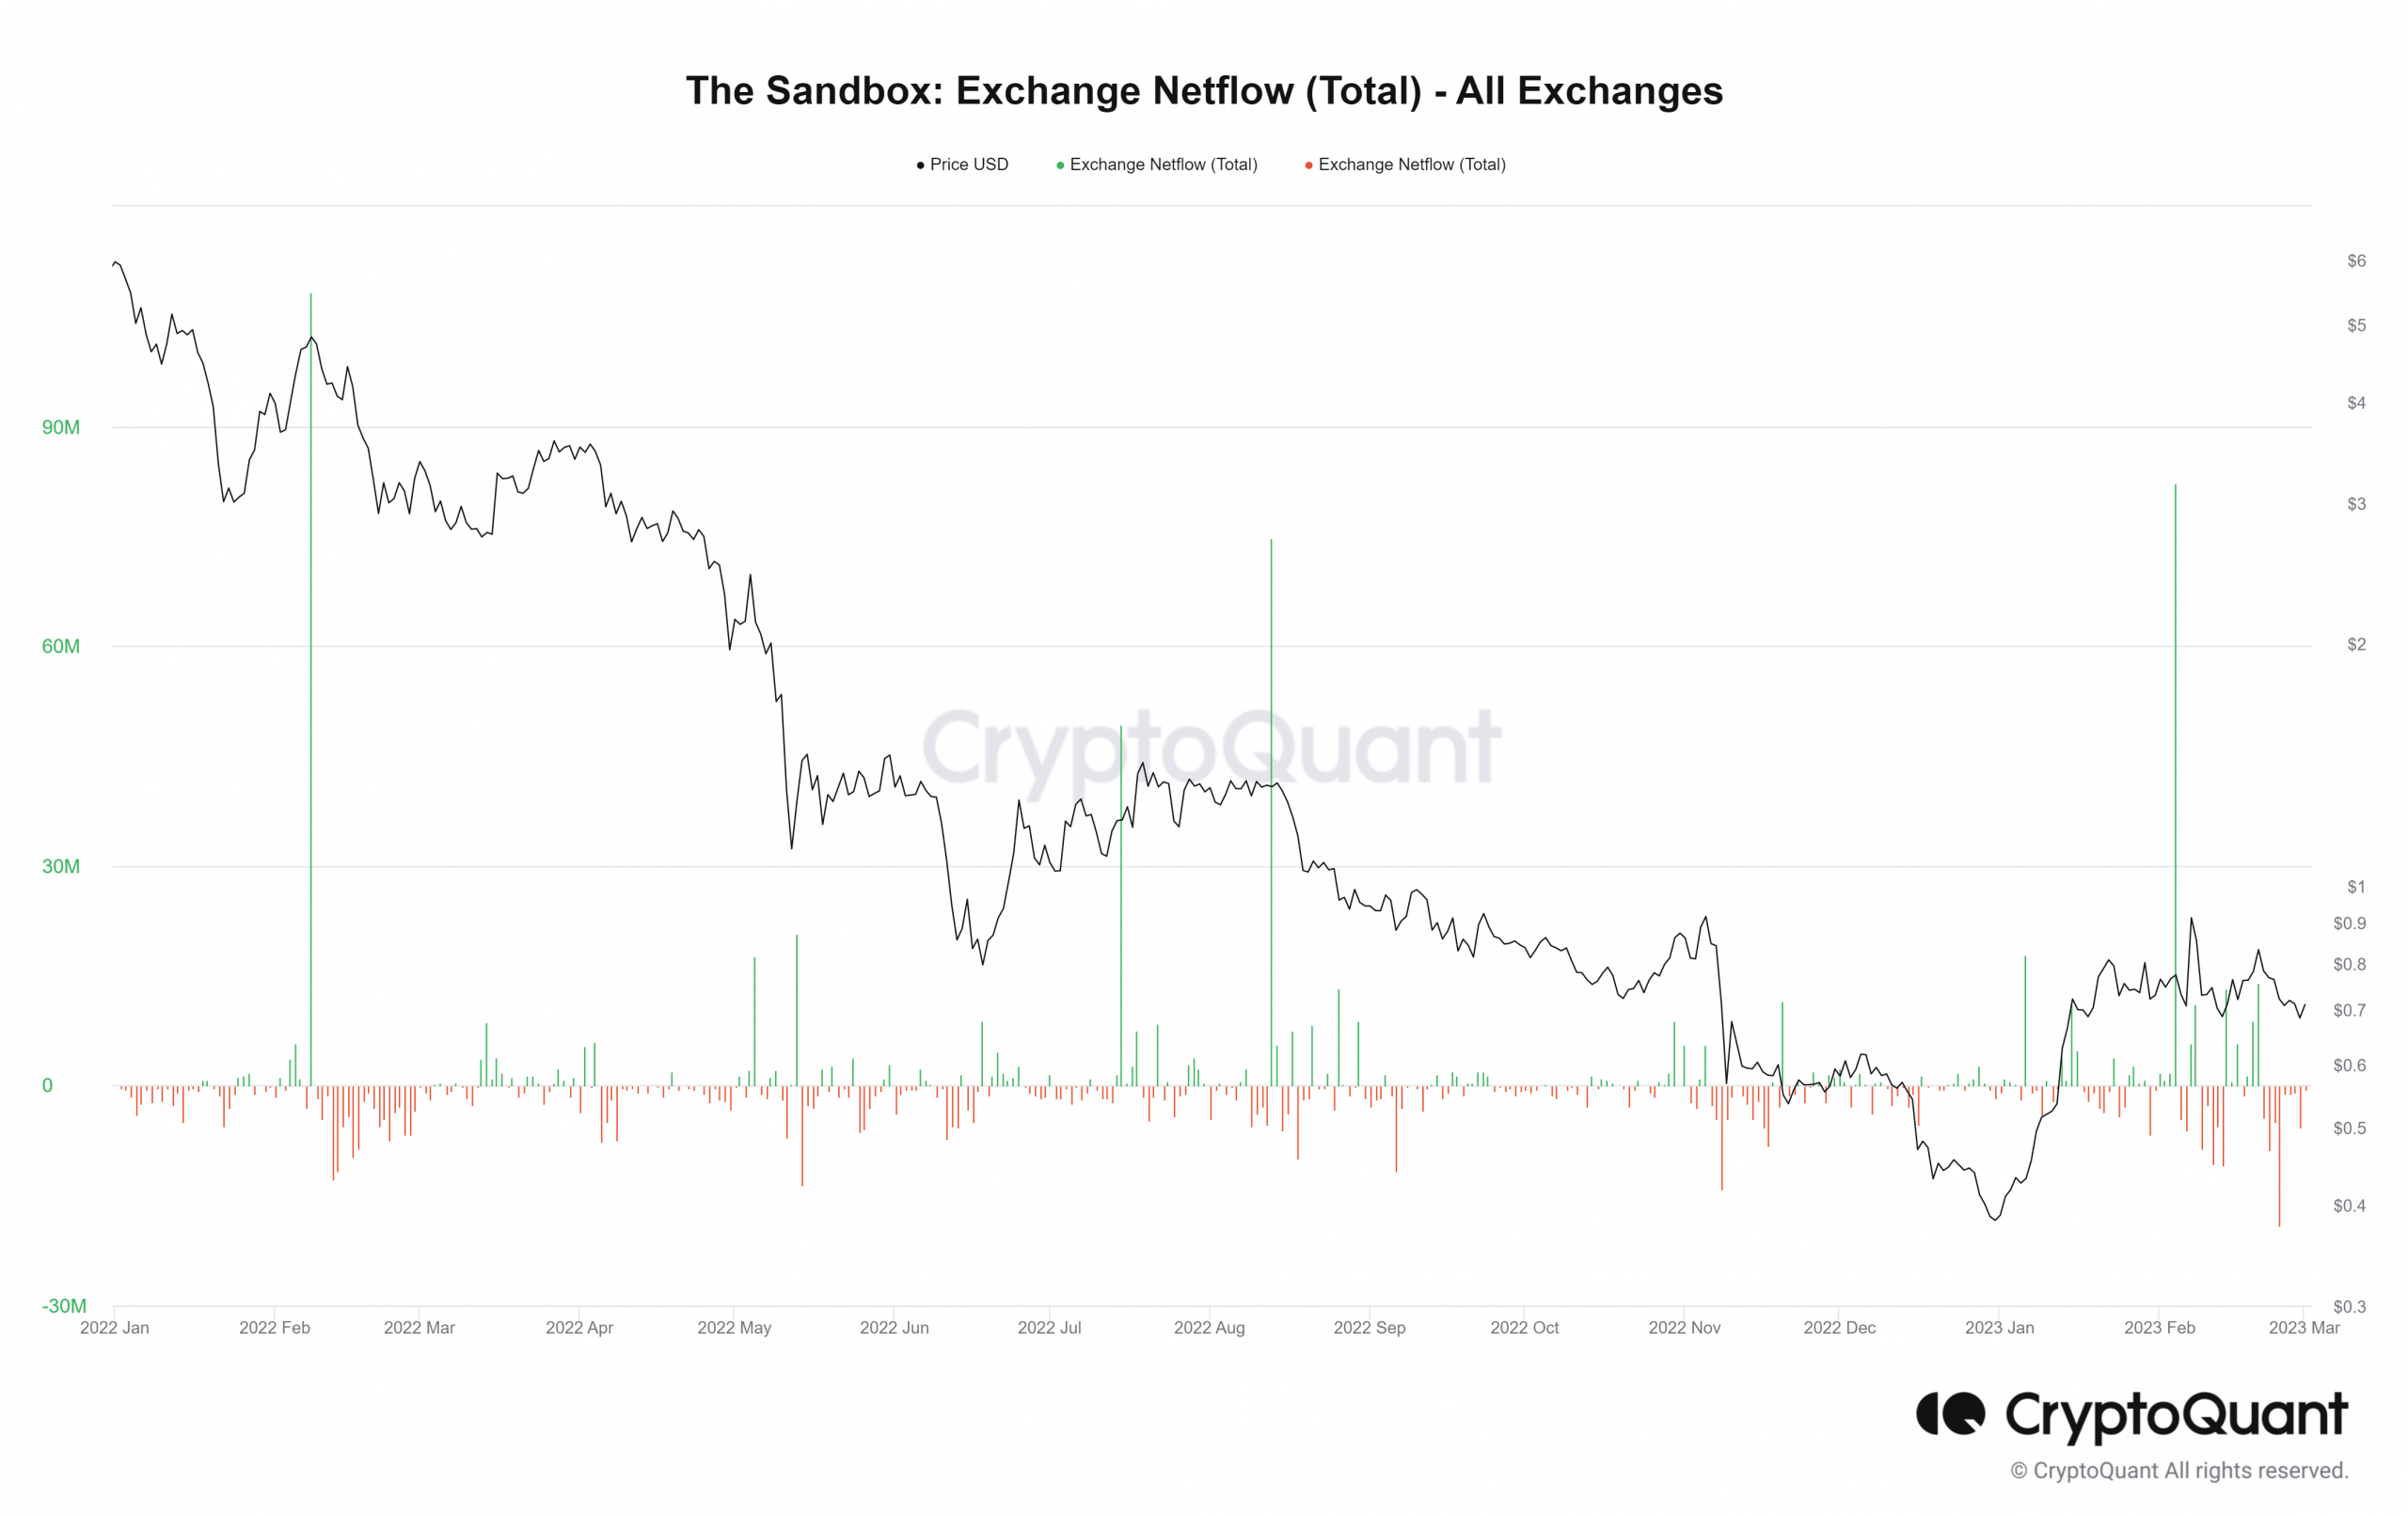
Like the Supply on Exchange statistic on Santiment, the Netflow metric on CryptoQuant revealed that SAND had a significant inflow into exchanges. However, the decrease in inflow and increase in outflow was made more evident by this statistic. According to the Netflow data, the outflow of the token dominated on 22 February 22.
On 25 February, there was a spike of over 19 million tokens. The predominance of outflow indicates that investors are not selling but were instead holding onto their money. Although this is good for SAND, the historical price movement after the unlock suggested that this may be the calm before the storm.
Source: CryptoQuant
Similar patterns were reportedly seen in August–September 2022 unlocking events, according to Santiment. After a month of token unlocking, however, the prices fell.
Price movement after August unlock
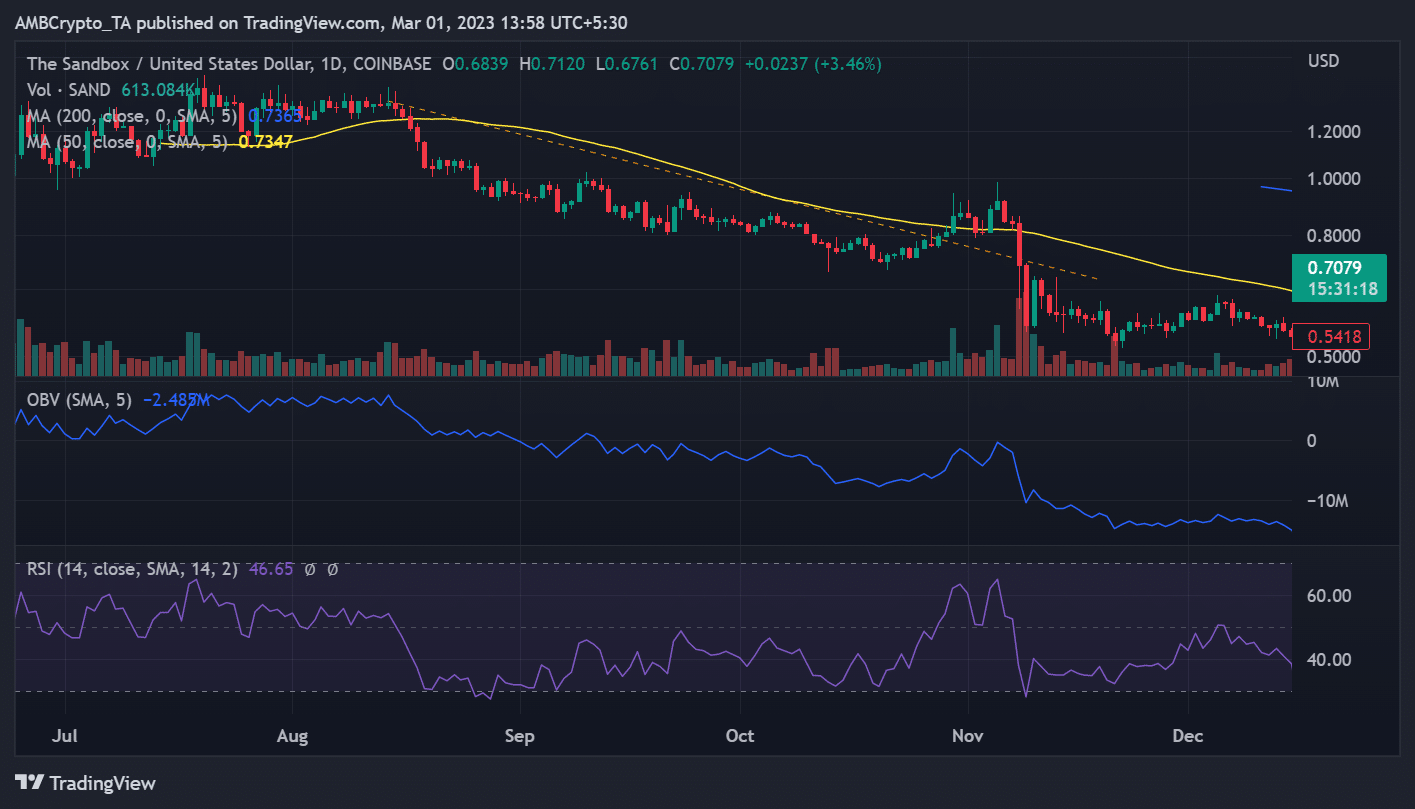
After the last token unlocks in August, the price fell by the end of September. The Sandbox was trading at roughly $0.9 on August 13 and 14, but by September’s end, it had dropped to roughly $0.6. The daily time frame of the chart allowed for the observation of a further drop.
Source: TradingView
The price movement after the unlock was upwards, as seen by a check at The Sandbox on a daily time frame. The trend lines, however, indicated that a drop had taken hold, and that there had been a downward trend. SAND was down a few days as of this writing but was currently trading at around $0.7, up over 3%.
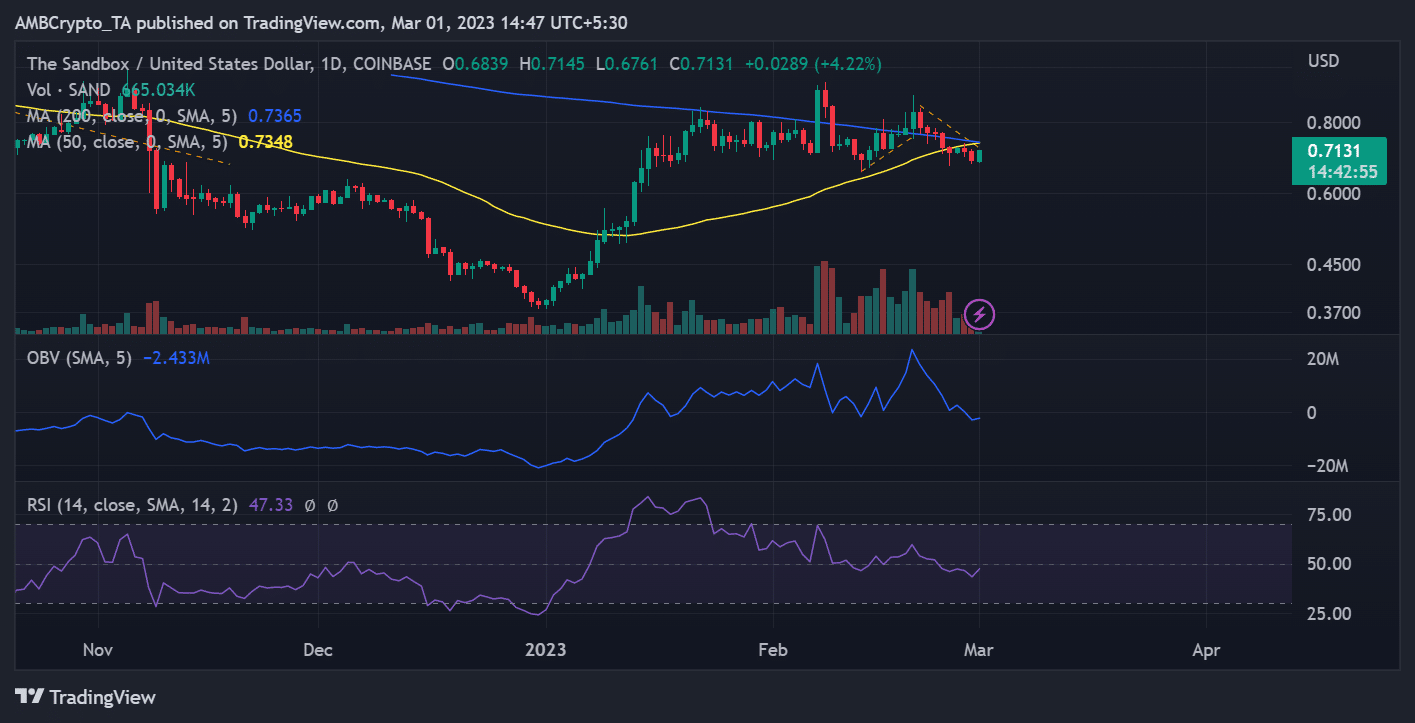
Source: TradingView
The chart also showed that the short Moving average (yellow line) was on the verge of crossing the long Moving average (blue line). This is known as a “golden cross,” which frequently signals the impending start of a significant price movement. The Relative Strength Index will cross the neutral line with the golden cross, sparking a bull trend for The Sandbox.
How much are 1,10,100 SANDs worth today?
For now, both SAND’s price action and exchange supply appear favorable. A panic sale, however, might send the price tending downwards, and we could be on the approach of repeating the past. Especially considering how the 30-day Market Value to Realized Value (MVRV) has shown a negative trend.
As of the time of this writing, the MVRV was around -5%. According to Token Unlocks, the next unlock event will take place in August 2023.


