• News
    • Bitcoin
    • Altcoins
    • Blockchain
    • DeFi
    • Regulation
    • Scams
  • NFT
  • Metaverse
  • Analysis
  • Learn
  • Videos
  • Blogs
  • Market Cap
  • Shop
What's Hot

Automated Swaps and No-Code API Integration

2026-05-13

What Is Parabolic SAR in Crypto: How PSAR Works

2026-05-13

What Is ADX in Crypto? Average Directional Index Explained

2026-05-13

Subscribe to Updates

Get the latest creative news from FooBar about art, design and business.

Facebook Twitter Instagram
Crypto Investor News Network
  • News
    • Bitcoin
    • Altcoins
    • Blockchain
    • DeFi
    • Regulation
    • Scams
  • NFT

    Bitcoin Just Hit an All-Time High. Nobody Cares

    2025-09-11

    All Eyes on Art: Upcoming Collections to Watch the Week of May 27

    2025-09-11

    Bitcoin Vegas Belongs to the Suits Now

    2025-09-11

    NFC Summit Lisbon Founder on Evolving the Event and Weathering the Market

    2025-09-11

    All Eyes on Art: Upcoming Collections to Watch the Week of June 3

    2025-09-10
  • Metaverse

    Shib: The Metaverse – Part of the Expanding Shiba Inu Ecosystem

    2025-01-03

    Experience to Earn: Everdome’s Metaverse Frontier

    2024-12-30

    Beyond Bots: Meta Motivo and the Dawn of Humanlike Digital Life

    2024-12-13

    Exploring NetVRk: What Is Behind This AI-Driven Virtual Universe?

    2024-10-28

    Council of Europe Highlights Metaverse’s Impact on Privacy and Democracy

    2024-09-05
  • Analysis

    Crypto Exchange Coinbase Lists New DeFi Altcoin Project Built on Base Blockchain

    2023-12-13

    Ethereum Price Bears Keep Pushing, Why Decline Isn’t Over Yet

    2023-12-13

    Trader Bullish on Cosmos (ATOM), Says One Dogecoin Rival Setting Up for Next Leg Up – Here’s His Outlook

    2023-12-13

    AVAX Price Pumps 50% and Dumps 15%, Why Uptrend Is Still Strong

    2023-12-13

    Top Trader Predicts Parabolic Rally for Solana Competitor – Here’s His Upside Target

    2023-12-13
  • Learn

    Automated Swaps and No-Code API Integration

    2026-05-13

    What Is Parabolic SAR in Crypto: How PSAR Works

    2026-05-13

    What Is ADX in Crypto? Average Directional Index Explained

    2026-05-13

    Mean Reversion Trading: Crypto Strategies & Risks

    2026-05-12

    What Are Moving Averages in Crypto? SMA, EMA & Signals

    2026-05-12
  • Videos

    Ray Dalio Says Central Banks WON’T Touch Bitcoin — He’s Dead Wrong

    2026-05-12

    Dumping BTC for AI?! 🤯 Agentic ETH, Massive Flows & Levge + AI Masterplan! 🚀

    2026-05-12

    This mean $320,000 BTC by Dec 2026!

    2026-05-12

    Bitcoin Just Flashed Its First Bull Signal Since 2023

    2026-05-12

    Bitcoin Investors…Banks are Worried

    2026-05-11
  • Blogs
  • Market Cap
  • Shop
Facebook Twitter Instagram TikTok
Crypto Investor News Network
Home»Analysis»‘Extra Bullish’ On XRP? Crypto Analyst Pinpoints Perfect Timing
Analysis

‘Extra Bullish’ On XRP? Crypto Analyst Pinpoints Perfect Timing

2023-10-18No Comments3 Mins Read
Facebook Twitter Pinterest LinkedIn Tumblr Email
Share
Facebook Twitter LinkedIn Pinterest Email

In a detailed chart analysis of the XRP/USD trading pair, seasoned crypto analyst Dark Defender has shed light on several significant indicators that point towards a bullish trajectory for the popular cryptocurrency.

Taking to Twitter to share his insights, Dark Defender remarked, “Morning All. Hope you had a great weekend. XRP in the daily time frame is still within our price range. Above $0.52 – $0.55 is a challenge, first to break the resistance & stay above the Ichimoku Clouds.”

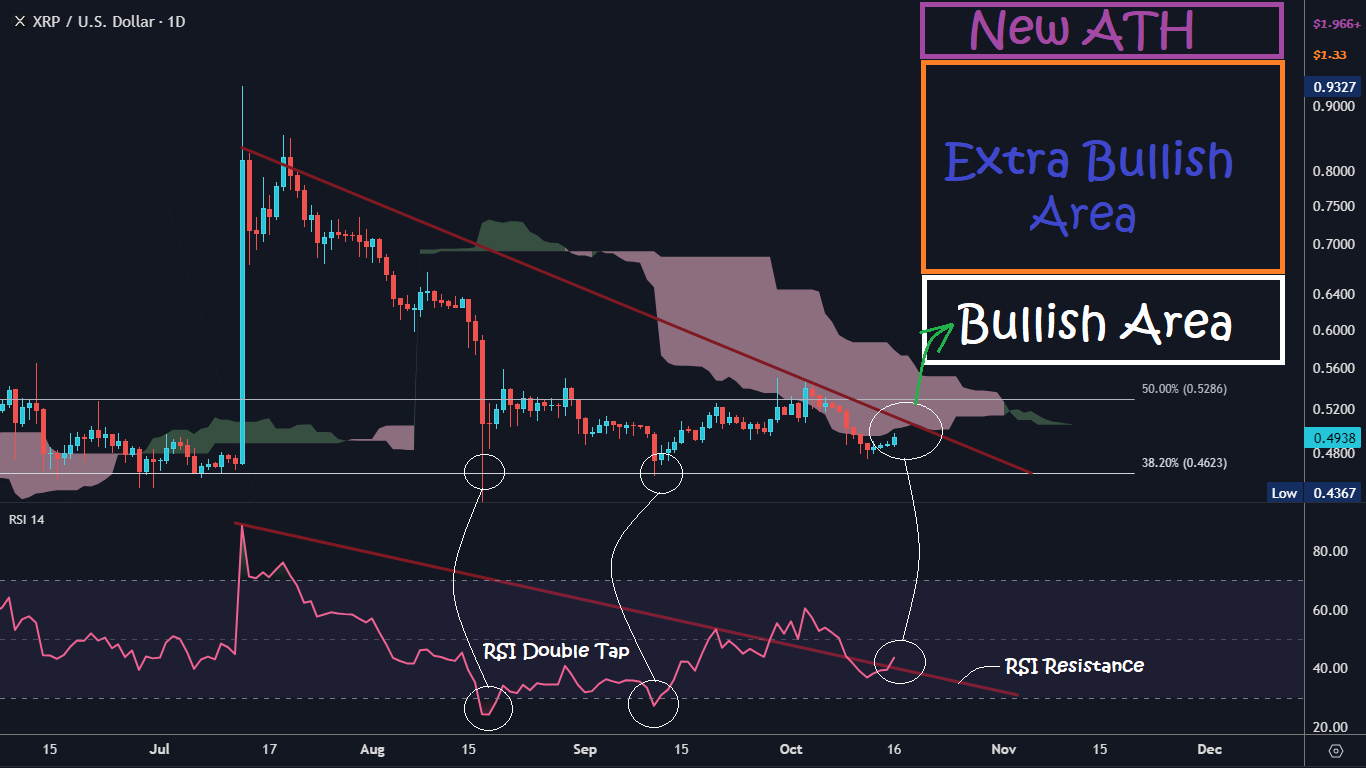
This sentiment aligns with the depicted interaction of XRP with the Ichimoku Cloud on the chart, a renowned technical tool that offers insights on support, resistance, and momentum. Furthermore, the analyst outlined specific price brackets, stating that XRP is: “Bullish above $0.55 – $0.66, Extra Bullish between $0.66 – $1.33, and envisions a New All-Time High Above $1.966.” These delineations echo the marked areas on the chart, notably the “Bullish Area” and “Extra Bullish Area.”

XRP price prediction
XRP price targets | Source: X @DefendDark

When To Get Extra Bullish On XRP

One of the primary takeaways from the chart is the “RSI Double Tap” event. For those unfamiliar, the Relative Strength Index (RSI) is a momentum oscillator that measures the speed and change of price movements. An RSI reading below 30 is typically considered oversold, while an RSI above 70 is seen as overbought. The “Double Tap” indicates that XRP has been undervalued in mid-August and mid-September, but found a strong foundation.

Further boosting the bullish sentiment is the declining trendline in the RSI that the XRP price recently broke out of, implying a potential shift in momentum. Remarkably, the RSI broke out of the downtrend for the first time at the end of September.

See also  Hollywood Director Booked 575% Profit on Dogecoin Bet Funded With Diverted Netflix Budget: Report

However, the XRP price could not keep this momentum, and as a result, the RSI once again fell below the trend line drawn by Dark Defender. But in recent days, another breakout has occurred, which could predict bullish price movements.

Moving onto the price action, the chart depicts XRP’s consistent interaction with the Ichimoku Cloud, a renowned technical tool that offers insights on support, resistance, and momentum. The fact that XRP is inching closer to entering the ‘Bullish Area’ of the Ichimoku Cloud is quite significant. This could mean that the asset is on the verge of a bullish reversal if it climbs back above $0.52.

Moreover, the chart also demarcates two distinct areas labeled “Bullish Area” and “Extra Bullish Area.” The latter is situated between the $0.66 and $1.33 mark, suggesting that if XRP manages to break above the lower boundary and hold above this price point, we might witness intensified bullish momentum. The XRP price could then more than double before major resistance is expected at the $1.33 level by Dark Defender.

Additionally, the Fibonacci retracement levels, drawn from the peak to the trough of the price movement, emphasize the 50% level at $0.5286 as a critical resistance point. Breaking through this level might propel XRP toward the “Extra Bullish Area” as specified by the analyst.

Concluding his tweet, Dark Defender aptly stated, “The clock is ticking,” indicating the expectation that the cryptocurrency could perform a strong bullish move into the “Bullish Area” between $0.55 and $0.66 at any time.

In summation, while the crypto market remains unpredictable, the technical indicators for XRP, combined with Dark Defender’s analysis, suggest a promising bullish trajectory. But as always, investors should conduct thorough research and remain cautious in their investment decisions.

See also  DOT Price (Polkadot) Surge to $5.5 – Are Bulls Ready For This?

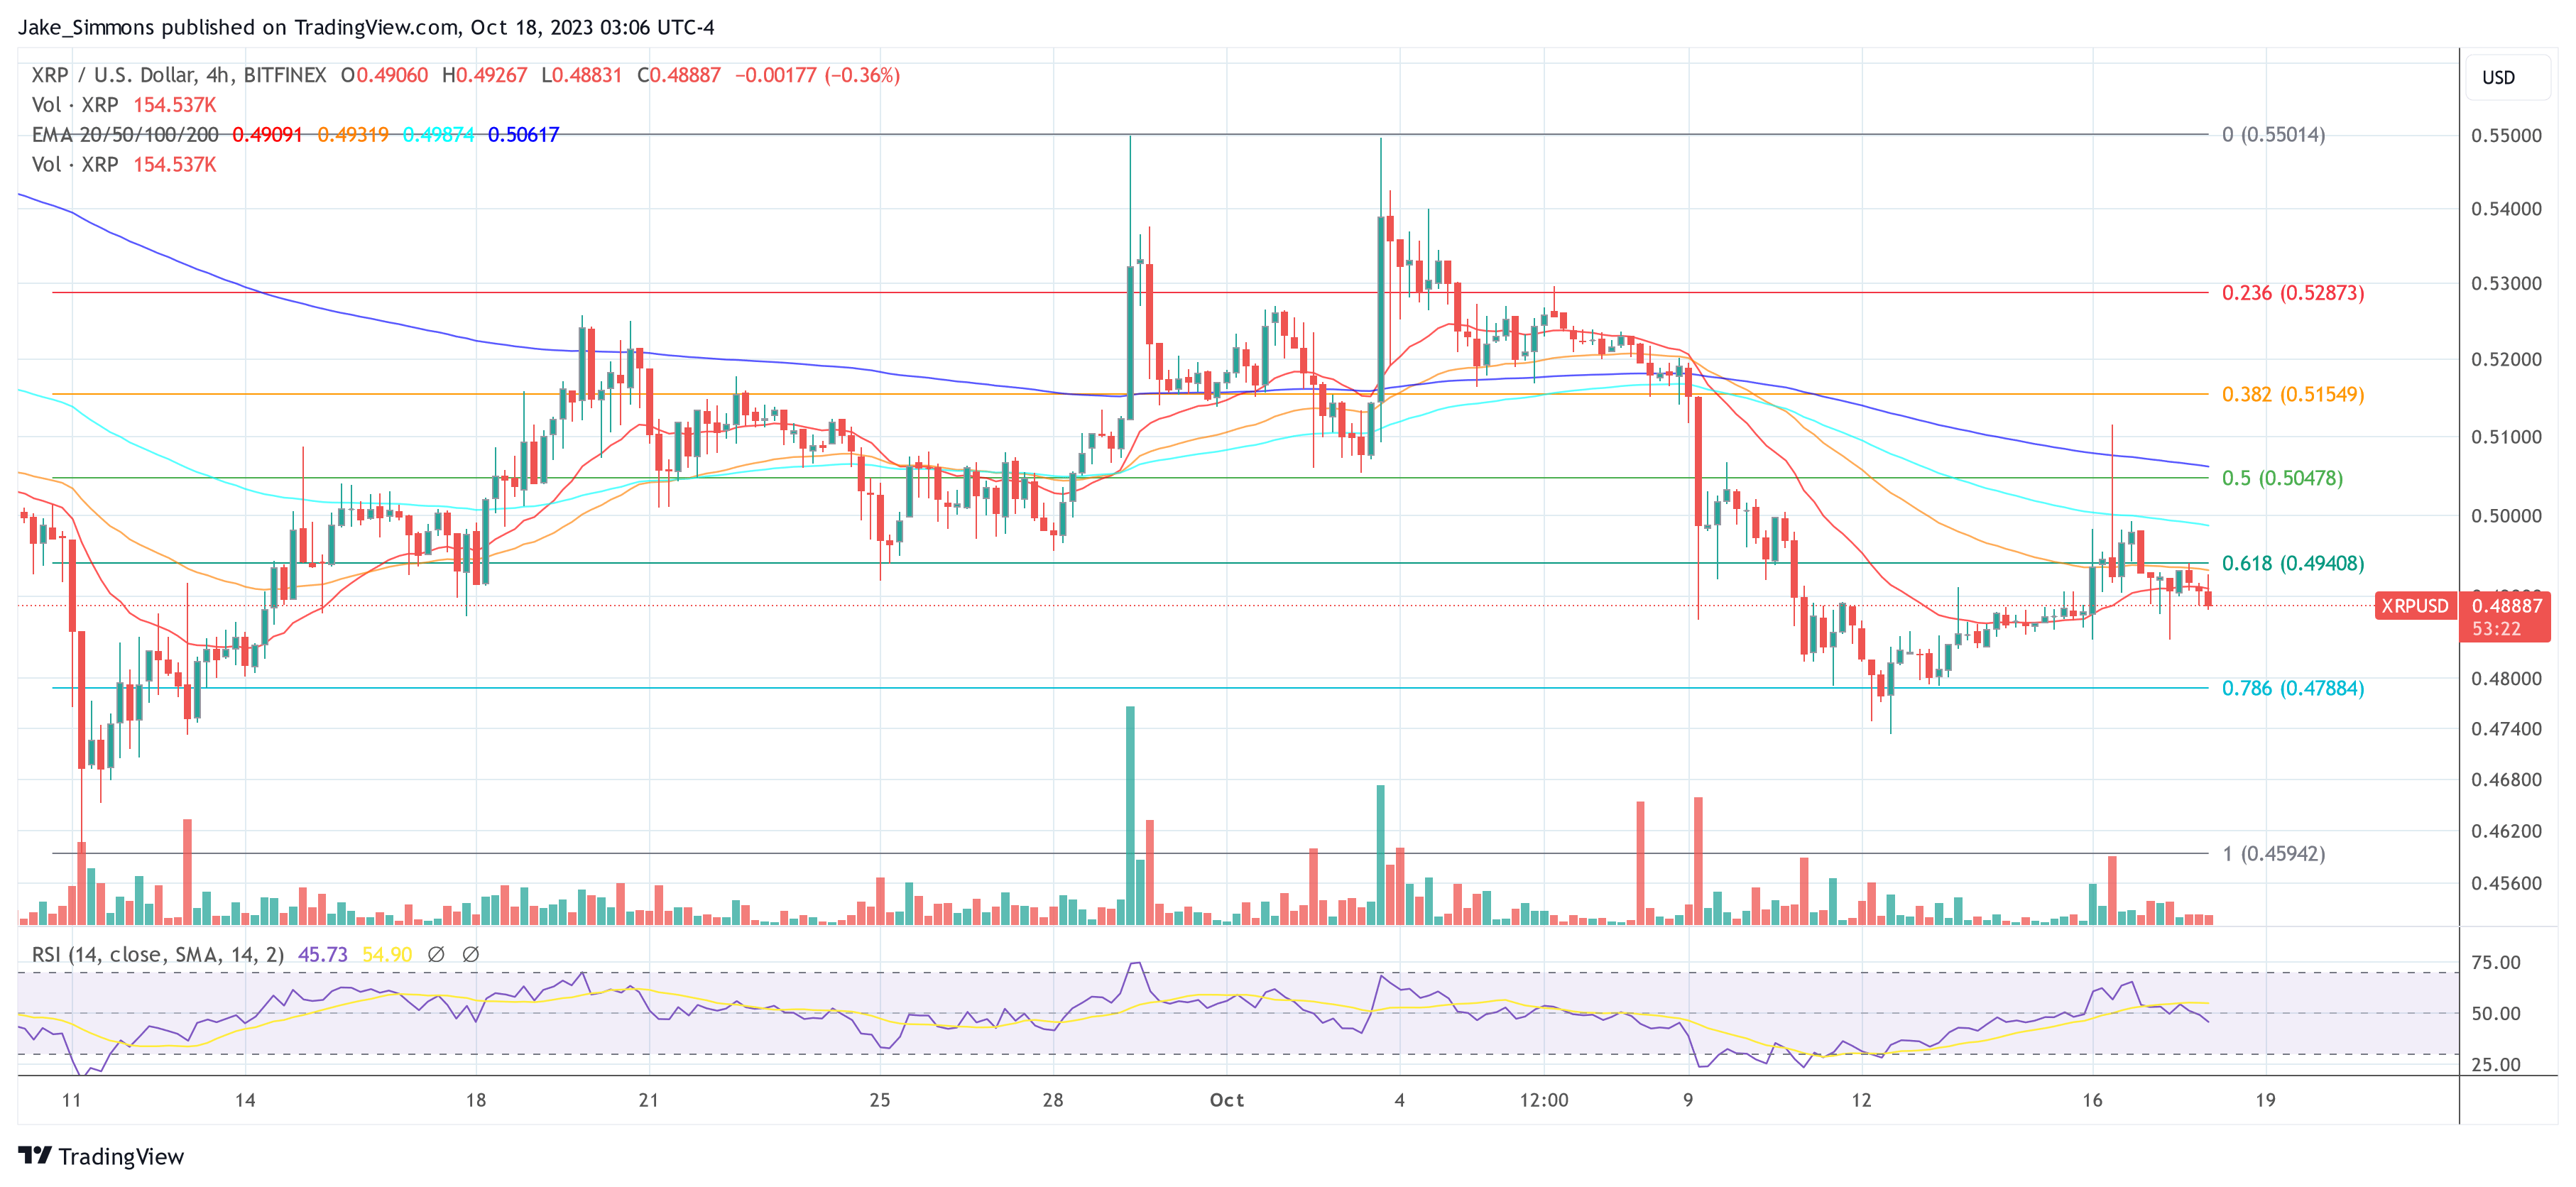
At press time, XRP traded at $0.4888.

XRP price
XRP falls below the 20-EMA, 4-hour chart | Source: XRPUSD on TradingView.com

Featured image from Shutterstock, chart from TradingView.com

Analyst Bullish Crypto Extra Perfect Pinpoints timing XRP
Share. Facebook Twitter Pinterest LinkedIn Tumblr Email

Related Posts

What Is Parabolic SAR in Crypto: How PSAR Works

2026-05-13

What Is ADX in Crypto? Average Directional Index Explained

2026-05-13

Mean Reversion Trading: Crypto Strategies & Risks

2026-05-12

What Are Moving Averages in Crypto? SMA, EMA & Signals

2026-05-12
Add A Comment

Leave A Reply Cancel Reply

Top Posts
NFT

Azuki, Beanz Creator Unveils Partnership With Line Friends (IPX)

2023-04-12

The Alpha Chiru Labs, the Web3 company best known for being the parent company of…

Altcoins

Cardano growth stagnates in Q3 – Here’s a rundown on what went wrong

2023-10-31

Cardano experienced a decline in network activity and revenue between July and September. In the…

Bitcoin

Is the Next Bitcoin Bull Run Tied To The US Presidential Elections? Here’s What History Tells Us

2023-05-09

Bitcoin (BTC), the world’s first and largest cryptocurrency, has been associated with several bull runs…

Subscribe to Updates

Get the latest news and Update from CINN about Crypto, Metaverse and NFT.

Editors Picks

Automated Swaps and No-Code API Integration

2026-05-13

What Is Parabolic SAR in Crypto: How PSAR Works

2026-05-13

What Is ADX in Crypto? Average Directional Index Explained

2026-05-13

Mean Reversion Trading: Crypto Strategies & Risks

2026-05-12
Crypto Investor News Network
Facebook Twitter Instagram TikTok
  • Contact
  • Terms & Conditions
  • Privacy Policy
  • DMCA
  • Disclouser
© 2026 - All rights are reserved.

Type above and press Enter to search. Press Esc to cancel.

bitcoin
Bitcoin (BTC) $ 79,498.00
ethereum
Ethereum (ETH) $ 2,263.32
tether
Tether (USDT) $ 0.999547
bnb
BNB (BNB) $ 675.27
xrp
XRP (XRP) $ 1.43
usd-coin
USDC (USDC) $ 0.999745
solana
Solana (SOL) $ 91.12
tron
TRON (TRX) $ 0.349456
figure-heloc
Figure Heloc (FIGR_HELOC) $ 1.04
staked-ether
Lido Staked Ether (STETH) $ 2,265.05