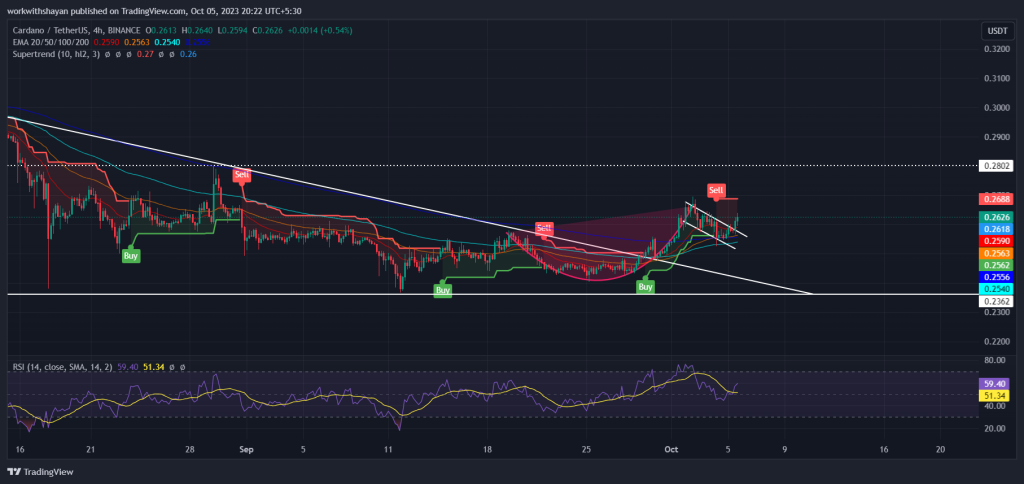
After Bitcoin confidently tested the $27K mark and recently surged past the $28,000 mark, numerous altcoins are showing a comeback, recovering from a significant sell-off by whales that occurred at the start of October. With the “Uptober” trend being revived now, Cardano is exhibiting signs of an upward trajectory, underscored by its formation of a bullish pattern. Furthermore, current on-chain data appear to be tilting in favor of buyers.
Traders Gain Confidence From ADA’s Dip
On-chain metrics reveal a surge in profit realization among Cardano investors, which was the reason for ADA’s price drop. Data from analytics firm Santiment highlights that AAVE, ADA, and CRV experienced notably higher levels of profit-taking among altcoins.
The metric in focus is the “ratio of daily on-chain transaction volume in profit to loss,” which provides insight into how a crypto’s volume of profit-taking stacks up against its loss-taking volume. However, ADA price has shown a strong battle against this metric as it now prepares for another surge. As a result, traders are now showing increased interest in activity.
Coinglass data unveils a striking surge in the Open Interest (OI) chart, soaring from a low of $100 million to a high of $103.6 million, marking a $3.6 million increase in futures contracts. Notably, traders are currently adopting a bullish position on these contracts.
The long/short ratio has also witnessed a surge, now leaning towards buyers with a trading ratio of 1.0129, as buyers claim their dominance with 50.3% of positions. Nonetheless, bears are maintaining a close rally, holding back a surge with 49.6% in short positions.
Furthermore, whales have not fully vacated their positions, as recent large transaction data does not offset the substantial $9 billion surge witnessed on October 2, suggesting that ADA’s price still holds the potential for an additional surge.
What’s Next For ADA Price?
Cardano’s price recently experienced a decline from the $0.27 mark following profit-booking; however, the downtrend slowed near the dip of $0.25 as buyers emerged with aggressive purchases. As a result, ADA price is now validating a ‘cup & handle’ pattern. As of writing, ADA price is trading at $0.263, surging over 3.2% from yesterday’s rate.

If the price validates the pattern and holds above the 20-day EMA, it would signal a shift in market sentiment from selling during rallies to purchasing during dips. Consequently, the bulls might attempt to send the price above $0.28, aiming for an upward trajectory towards $0.3 and subsequently $0.32.
Conversely, to eliminate the rally, bears would need to pull the price beneath the 20-day EMA. Under this scenario, the ADA price might once again test the support at $0.25. If this fails, the ADA price might head toward the crucial support of $0.23.


 The Craziest
  BULLISH
  Signals EVER