


intermediate
Candlestick charts are, in a way, a symbol of trading. They are the first thing people think of when they imagine traders, alongside line charts and red/green numbers on a big screen.
Although they may seem confusing at first glance, candlestick charts are actually quite easy to read — and in order to start using them to your advantage, you only need to learn a few patterns. In this article, we will provide you with all the tips you might need to learn how to read candlesticks!
What Are Candlestick Graphs/Charts?
Candlestick charts are graphical representations of price action during a specific time period. They look like boxes that have straight lines going out of them at the top and the bottom. While candlesticks can represent any timeframe — a year, a month, a day, a minute — the ones on the same chart always reflect the same time period.
This type of chart was invented back in the 18th century by a Japanese rice trader called Munehisa Homma. They were introduced to the Western market via Steven Nison’s book “Japanese Candlestick Charting Techniques”.
Candlestick charts can be used to analyze any information on financial markets, the stock market, and, of course, the crypto market, too. They are one of the best tools for predicting future short-term price movements of assets.
Candlestick vs. Bar Charts
Bar charts and candlestick charts have many similarities. Most importantly, they both show the same information: open, close, and high and low prices. The differences between them are quite minor, and traders usually choose to use one or the other based on personal preferences.
Here’s what a typical bar chart looks like:
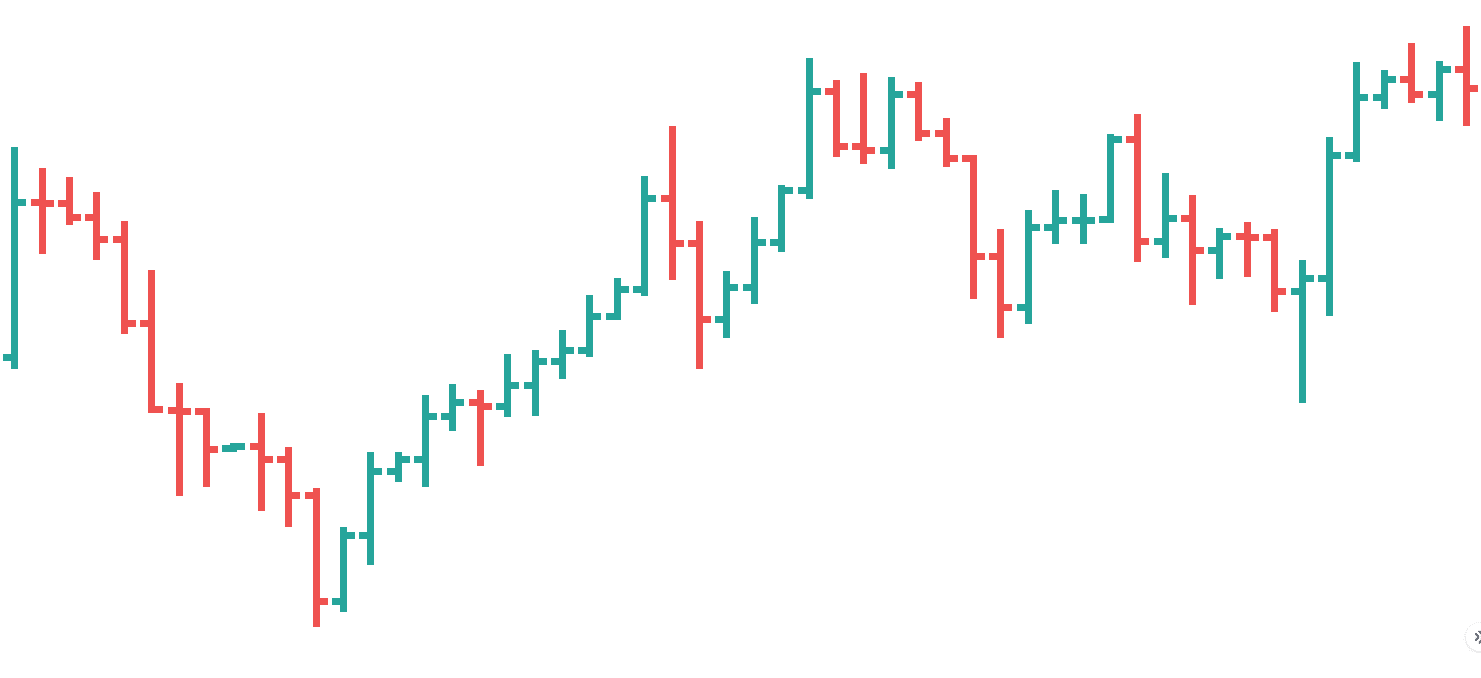
Bar charts also usually come in two colors (e.g., red and black). Unlike candlestick charts, bar charts place greater importance on the relation of the current period’s close price to that of the previous “bar.”
Composition of a Candlestick Chart
Candlestick charts are comprised of a collection of multiple candles, and each of them represents a predetermined period of time.
Each candle in a chart has the same structure: it is made up of a body and two wicks (also called “shadows”).
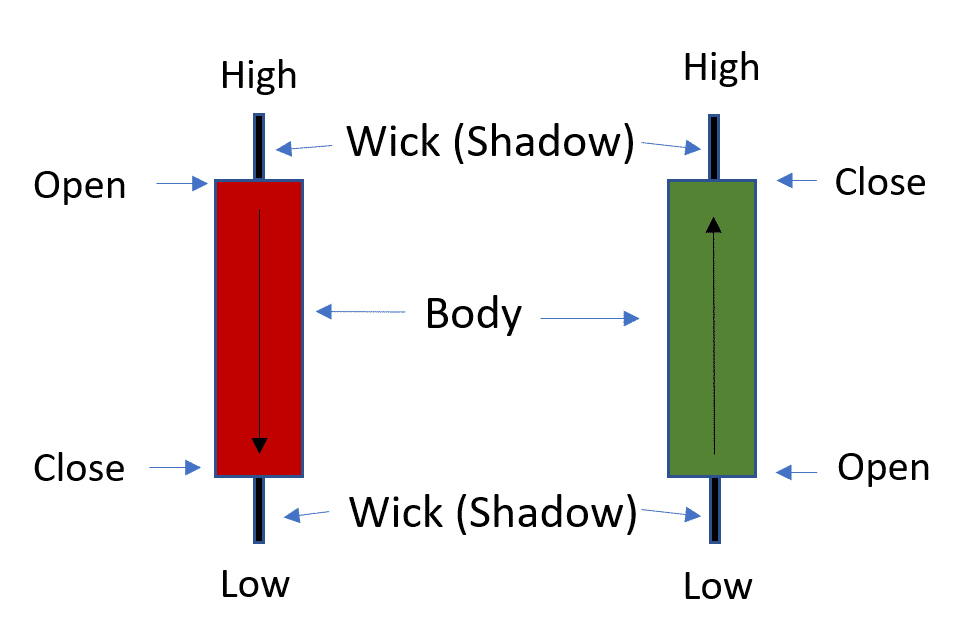
Depending on the color of the candlestick body, its top can either represent the closing or the opening price.
- “Open” is the initial price at which the asset was being traded at the beginning of that specific timeframe.
- “Close” is the last recorded price of the asset in that specific timeframe.
- “Low” is the lowest trading price of the asset during that time period.
- “High” is the highest recorded price of the asset in that timeframe.
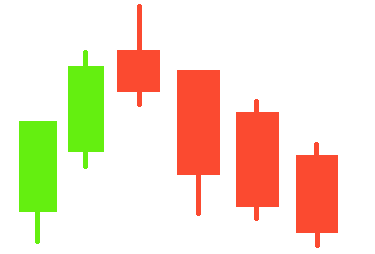
How Do You Read Candlestick Charts for Day Trading for Beginners?
When you read candlestick charts, there are three main things that you can note: the color of the body, its length, and the length of the wicks.
Color
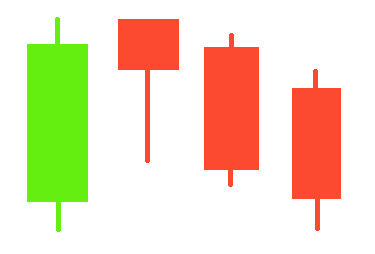
Candlesticks come in two colors: red and green. The former is called a “bearish candle,” while the latter is a “bullish candle.” Just like the name suggests, they represent bearish or bullish price movement during that specific time period.
A bearish candle represents a period during which the closing price was lower than the opening price — it means that the price of an asset has dropped in that timeframe.
A bearish candlestick represents a period during which the opening price of an asset was lower than the closing price.
Body Length
Body length represents how different the opening and closing prices were; it shows the buying/selling pressure during that specific time period. The longer the body, the more intense the pressure. A short candlestick represents a market with little price movement.
Wicks Length
The shadow, or wick, length represents the difference between the opening/closing price and the highest/lowest price recorded during that time period. Shorter wicks point toward most price action being huddled around the closing and opening of the candlestick.
There are many ways to interpret the wick length in relation to all the information shown by a candlestick, but here’s a simple rule of thumb: remember that the upper shadow, the one that shows the highest price recorded, is a representation of buyers. The lowest price recorded is set by the sellers. A longer shadow on either side represents the prevalence of that side’s presence on the market, whereas equally long wicks on both the top and bottom of the candlestick show indecision.
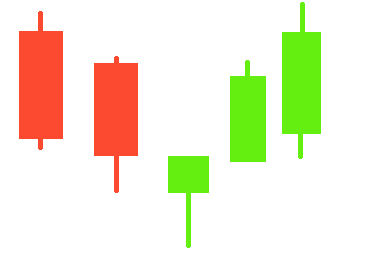
How to Analyze a Candlestick Chart
There are many ways to analyze candlestick charts — they are a great tool for making every trading session count. However, if you are a beginner, we would recommend learning how to interpret and identify candlestick chart patterns.
How Do You Predict the Next Candlestick?
Candlesticks reflect market sentiment and can often be used to predict what is going to happen next.
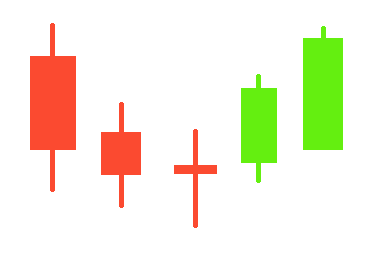
There are many things to look out for, but you will only begin to notice most of them as you gain trading experience. Here are the two main simple candlestick patterns that can help you predict what’s going to happen next.
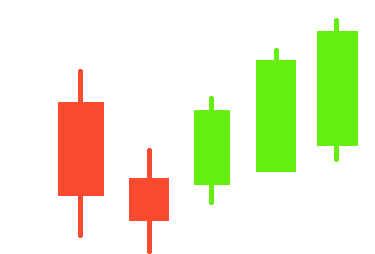
- Long green candlesticks can indicate a turning point and a potential beginning of a bullish trend after a long decline.
- Conversely, long red candles signify a potential beginning of a bearish trend and may indicate panic on the market if they show up after a long decline.
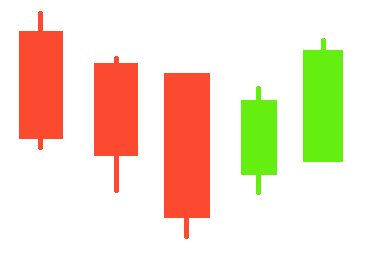
Basic Candlestick Patterns
There are some basic candlestick chart patterns that can help anyone, especially beginners, better understand what’s going on in the market.
Bearish Patterns
Bearish patterns like the bearish engulfing, dark cloud cover, or the bearish abandoned baby can signal that the market is either about to continue its downtrend or enter one after a previous uptrend. Here are some of the bearish candlestick patterns that can help you out when looking for buying and selling opportunities.
Hanging Man
A hanging man is a bearish reversal pattern, meaning it shows that the price trend will soon turn red. This candlestick pattern is usually formed at the end of an uptrend and consists of a candle with a small body and a long lower wick.
A long lower wick on a candle with a relatively short body after an uptrend shows that there has been a massive sell-off. Although the price has been driven up, there may be a chance the recovery is temporary, and bears are about to take control of the market.
Shooting Star
This candlestick pattern usually appears after a price spike and is made up of a short (typically red) candle with a long upper wick. It usually has no lower wick to speak of and represents a bearish market reversal.
The shooting star candlestick chart pattern signifies that although bulls are still willing to pay high prices, the current trend is reversing, and the majority of the market is trying to sell. However, it can be deceiving, so we recommend waiting for a few more candlesticks before making any decisions
Bearish Harami
This candlestick pattern is represented by a small red candle that follows a longer green one. The red candle’s body can be completely engulfed by the body of the previous candle.
A bearish harami can indicate a decrease in buying pressure.
Bullish Patterns
Candlestick chart patterns like the morning star or the bullish abandoned baby all show either a continuation or the beginning of an uptrend. Here are some other candlestick patterns that give a bullish signal.
Hammer
This is a bullish equivalent of the hanging man. This candlestick pattern consists of a downtrend that includes a candle with a long lower wick at its bottom. The lower shadow has to be at least twice the size of the candle’s body for it to be considered a hammer.
This is a bullish reversal candlestick pattern: the long lower wick shows that the selling pressure was high, but, despite that, the bulls managed to win in the end. A short body shows that the closing price was close to the opening one, meaning bears didn’t manage to drive the price of the asset down.
Hammers can be both red and green, but the latter represents even stronger buying pressure.
There’s also an inverted version of the same pattern. The inverted hammer candlestick pattern has a long upper wick instead. It also typically points toward a bullish trend reversal.
Bullish Harami
Just like the bearish Harami, the bullish one also has a longer candle followed by a much smaller one. Only in this candlestick pattern, a long red candle is followed by a smaller green one instead. It shows the slowdown of a downward trend and a potential bullish reversal.
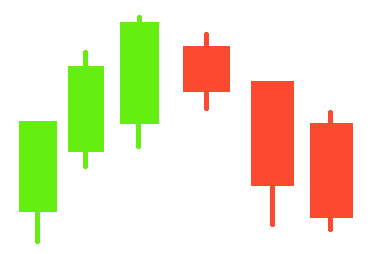
Three White Soldiers
This is a rather straightforward bullish reversal pattern — it is made up of three consecutive (typically) long green candles that all open above the previous candle’s opening price but below its close. The three white soldiers also close above the previous candle’s high.
These candles usually have short wicks and indicate a steady buildup of buying pressure on the market. The longer their bodies, the higher the chance that there will be an actual bullish reversal.
What Is the Best Candlestick Pattern to Trade?
The best candlestick pattern to trade for beginners is the one that’s the easiest to identify… and that’s doji.
It is a candle that has an extremely short body (well, no real body to speak of, actually), and if it appears after a steady downtrend/uptrend, it can signify a reversal.
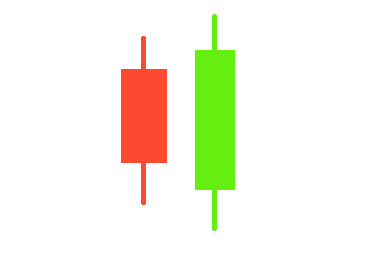
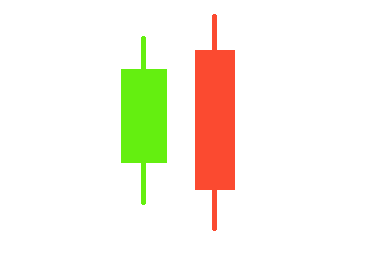
Another easy-to-identify candlestick pattern is the engulfing pattern. It can be either bearish or bullish and is made up of two candles, with the second one completely “engulfing” the other.
A bullish engulfing pattern has a green candle engulfing the red one and signifies that there is strong buying pressure and bulls are taking over the market.
A bearish engulfing pattern, on the other hand, shows the possibility of the market being taken over by the bears. It has a red candle engulfing the green one.
Do Candlestick Charts Work?
Learning how to read a candle chart and recognize candlestick patterns can indeed be very profitable. Although they are most effective for experienced traders, they can be quite useful for beginners, too.
Keep in mind, however, that there is a lot of information that a candlestick chart will not be able to show you — for example, the sequence of events during the chosen timeframe, the relation of the current crypto and stock price to the ones from the previous periods, and so on.
Additionally, candlestick charts can become unreliable even on the stock market during times of great volatility. Keep that in mind when using them for crypto trading, which can be extremely speculative.
Is Candlestick Trading Profitable?
Candlestick charts can be used to create successful and effective day trading strategies and trading decisions. However, it is not enough just to understand what the figures in the chart mean — in order to make a profit, you need to learn how to understand the market, use support and resistance levels, stop-loss orders, follow the latest news, and more.
Which Candlestick Pattern Is the Most Bullish?
There are many strong bullish candlestick patterns, and it is hard to determine the most decisive out of them.
Generally speaking, the bullish engulfing pattern, hammer, and bullish harami are all named the strongest bullish candlestick patterns.
What Do Candlesticks Represent in Stocks?
Stock candle patterns can display price direction and signal a continuation or a reversal of a price trend. Every single candlestick represents market data about the asset’s trading value during a predetermined period of time. The candle body, for example, can show whether the asset’s closing price was lower (red) or higher than its opening price (green).
Disclaimer: Please note that the contents of this article are not financial or investing advice. The information provided in this article is the author’s opinion only and should not be considered as offering trading or investing recommendations. We do not make any warranties about the completeness, reliability and accuracy of this information. The cryptocurrency market suffers from high volatility and occasional arbitrary movements. Any investor, trader, or regular crypto users should research multiple viewpoints and be familiar with all local regulations before committing to an investment.